
Glaucia Mendes Souzaa†, Reynaldo L. Victoriaa, Luciano M. Verdadea, Carlos A. Jolyb, Paulo Eduardo Artaxo Nettoa, Heitor Cantarellac,
Helena L. Chumd, Rocio Diaz-Chaveze, Erick Fernandesf, Geoff Fincherg, José Goldemberga, Luiz Augusto Horta Nogueirah, Brian J. Huntleyi, Francis X. Johnsonj, Angela Karpk, Manoel Regis L. V. Leall, Lee R. Lyndm, Isaias de Carvalho Macedob, Rubens Maciel Filhob, Mariana P. Massaferaa, André M. Nassarn, Francisco E. B. Nigroa, Patricia Osseweijero, Tom L. Richardp, Jack N. Saddlerq, Jon Samsethr, Vikram Seebalucks, Chris R. Somervillet, Luuk van der Wieleno, Marie-Anne Van Sluysa, Jeremy Woodse, and Heather Youngst
Contact: †glmsouza@iq.usp.br
aUniversidade de São Paulo, Brazil; bUniversidade Estadual de Campinas, Brazil;
cAgronomic Institute of Campinas, Brazil; dNational Renewable Energy Laboratory, USA;
eImperial College London, UK; fWorld Bank, USA; gThe University of Adelaide, Australia;
hUniversidade Federal de Itajubá, Brazil; iStellenbosch University, South Africa;
jStockholm Environment Institute, Sweden; kRothamsted Research, UK;
lLaboratório Nacional de Ciência e Tecnologia do Bioetanol, Brazil; mDartmouth College, USA;
nAgroicone; Brazil; oDelft University of Technology, The Netherlands;
pPennsylvania State University, USA; qUniversity of British Columbia, Canada;
rOslo and Akershus University College of Applied Sciences, Norway;
sUniversity of Mauritius, Mauritius; tUniversity of California Berkeley, USA

2.1 Introduction
Substantive evidence exists that many bioenergy cropping systems can bring multiple benefits and off-set environmental problems associated with fossil fuels, intensive food production and urbanization1. As for any other developmental change, however, this does not mean that bioenergy does not present any risks, but rather that such risks can be managed through the adoption of appropriate policies, promotion of suitable energy feedstocks, and management practices. In this chapter we present a summary of numbers regarding current use and expansion of bioenergy as well as aspects that constrain the realization of its multiple benefits.
This chapter is part of the synthesis of the SCOPE Bioenergy & Sustainability volume and includes the contribution of its editors, scientific advisors, background and crosscutting chapter authors. SCOPE Bioenergy & Sustainability includes the contributions of 137 authors from 82 institutions in 24 countries. The Bioenergy Numbers section is a selection of some of the key numbers that substantiate the Key Findings of SCOPE Bioenergy & Sustainability volume. For additional details refer to the synthesis volume chapters.
2.2 Bioenergy Production Now
Total global primary energy use is around 550 EJ. Biomass as a source of energy currently contributes to approximately 10% of primary energy used – 62 EJ. Traditionally, bioenergy production is mostly wood-based, and is generated by direct inefficient combustion (burning), although other crop wastes and residues are also used2. In 2010, traditional bioenergy amounted to around 40 EJ/yr3 primarily used for household cooking. More efficient conversion processes are increasingly being implemented using wood pellets4.
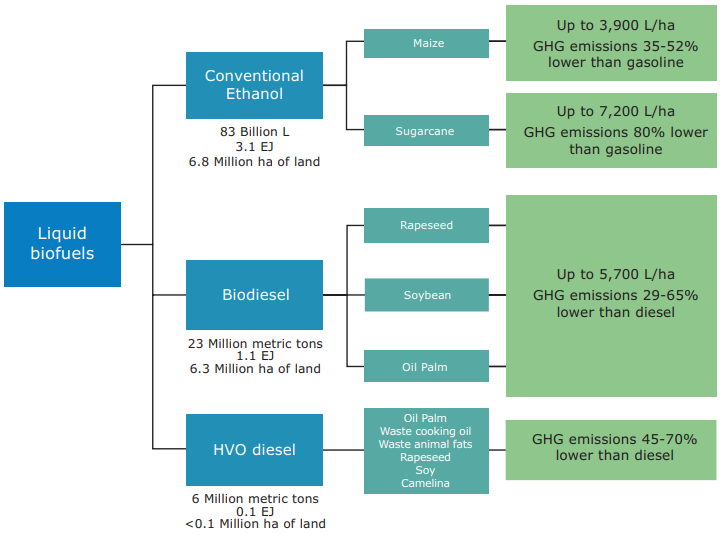
Liquid biofuels have been used for transportation fuel, direct heating and lighting. In some countries, biofuels have become an important contribution to the energy matrix but globally, they currently make a small contribution (4.2 EJ). Biofuels are expected to play a more important and larger role in the world’s fuel supply, increasing from just under 2% of oil equivalent for the globe as a whole today to as much as 30% by mid-century5. Current world production of biofuels is over 100 billion L (88 Gl ethanol and 20 Gl biodiesel). The leading producer in 2012 was the USA, followed by Brazil, China, the EU and Canada. Lignocellulosic biofuels production has advanced but with a few plants worldwide represents a small share (0.2% of total global biofuel production).
Global demand for wood has been increasing by 1.7% annually6. Non-traditional biomass is expected to grow from 526 mega metric tons of oil equivalent (Mtoe) in 2010 to nearly 1200 Mtoe by 2035, growing at a rate of 3.3% per year7. Between 2005-2013, there was a three- and four-fold increase in production of wood pellets for electricity, heat, or combined heat and power (CHP), and of liquid fuels for transport. Gaseous biofuels had an average growth rate of 15% per year while liquid biofuels grew at a 12% annual rate between 1990 and 20088. Today bioethanol represents the fastest growing renewable fuel substituting for almost 10% of the volume of gasoline used in vehicles in the USA and about 40% in Brazil. The role of biomass in bioelectricity, heating and cooling is also expected to grow considerably in the future9. Brazil’s sugarcane industry-wide electricity generation nearly doubled since 2006-200910.
2.2.1 Current Feedstocks
Today, the world produces more maize than any other grain or seed. Maize as feedstock accounts for more than 95% of fuel ethanol production in the USA providing more than half of all of the fuel ethanol produced in the world. US production of maize grain from 2006-2010 averaged 311 Mt yr-1, of which 94 Mt yr-1 was used for ethanol production and 54 Mt yr-1 exported. Globally, research and development (R&D) boosted maize yields per hectare by 30% over the past decade of which the introduction of genetically modified (GM) traits accounted for one-third of the increase. Innovation in maize production and processing improved ethanol greenhouse gas (GHG) benefits versus fossil fuels by 35%, reduced fossil energy use in ethanol production by 30%, and process water use by a factor of 211. Of the global 880 Mt of maize production, the USA accounts for just over 40%, yet is grown on just 20% of the land planted to this crop globally. In the USA whereas an acre of maize farmland produced an average 138.2 bushels in 2001, the average yield was 152.8 bushels per acre in 2010. The average annual increase in maize yield in the USA between 1983 and 2013 was 0.17 t ha-1 yr -1 12.
Sugarcane has a well-established agricultural production system and processing infrastructure to make it among the most advanced feedstocks for bioenergy. Sugarcane is a major crop grown in the tropical and subtropical regions of the world. Nearly 1.8 billion metric tons of sugarcane biomass were produced in 2012 in more than 100 countries. The calculated average energy content of the total above ground biomass is 7,400 MJ t-1 of cane for an average crop of around 70 t ha-1 yr-1 (more than 500 GJ ha-1 yr-1). Sugarcane is planted once and harvested repeatedly after 12 to 18 months of growth for 5 to 6 years. Approximately one-third of the total energy in the above-ground biomass of today’s sugarcane cultivars, is captured as the sucrose fraction present in the stalk while another third is present in the bagasse and the last third is the straw left in the field after mechanical harvesting. Currently, sugarcane provides 17.5% of Brazilian primary energy supply. In 2010, Brazil supplied 25 billion liters of ethanol using sugarcane as feedstock and 2.5 billion liters of biodiesel from soy oil, totaling 25% of global biofuels (0.62 EJ biofuel out of 2.5 EJ global)13. Today there is an increasing awareness that sugarcane can be used for many applications, not only as a biomass feedstock for energy production but also for bioprocessing in a biorefinery into a wide range of chemicals including a variety of polymers. Life cycle analyses indicate that sugarcane would be highly competitive with other crops as a preferred feedstock for a biomass-based industry14.
| Box 2.1. Improving use of wood to decrease pollution Approximately 30 EJ of traditional biomass was derived from direct biomass burning, 3EJ from charcoal and only 1EJ from modern solids (pellets and chips) as recently as 2007a. In developing regions about one-third of traditional biomass energy was estimated to be supplied from forests, with two-thirds from trees interspersed in agricultural cropland and grasslands, as well as livestock manures and crop residuesb. Around 2.8 billion people in the world rely on solid fuels for cooking and heatingc, whose consumption causes respiratory illnesses and close to 1.6 million deaths per year, of mainly women and childrend. In India solid fuels account for about 63% of the total household energy consumption with significant contributions to both CO2 emissions and indoor air hazards, Cambodia, with 1,304 deaths per million people in 2004 and India with 954 deaths, occupy the top two positions in deaths due to indoor pollution, one of the top causes of death in the worlde. Increasingly, bioenergy production from wood is being improved. Wood represents an important share of total primary energy supply in some industrialized countries using efficient steam power systems, generally in co-generation schemes (e.g. Finland (28%), Latvia (28%), Sweden (27%), Denmark (19%))f. The use of bioenergy has increased steadily in Scandinavia and has reached about 20% of the total energy supply in Sweden. Most of Scandinavian bioenergy comes from the forestsg. Wood pellet production as of 2011 has grown to 22 million metric tons or some 350 PJh. Estimated consumption of wood pellets in EU alone was 12 million t/year, in 2012i. |
In Europe, ethanol production uses multiple feedstocks such as wheat, corn, barley, rye, and sugar beet derivatives; the total weight of grain feedstocks is the same as that for beet derivatives used for a total production of about 4.5 billion liters of ethanol or about 5% of EU gasoline use.
There are around 350 oil-bearing crops identified as potential feedstocks for biodiesel production in the world. Soybean, rapeseed/canola and oil palm are the main products processed commercially.
Oil palm is the most productive source of oil for biodiesel. The high yield of oil palm means that the current global output of 65 Mt palm oil requires cultivation of only 15 Mha, which contrasts dramatically with the 194 Mha needed to produce just 87 Mt oil from temperate annual oilseed crops such as soybean, rapeseed and canola. Therefore, in terms of total oil yield (kernel + mesocarp oil) per hectare, oil palm is already more than 6.5-fold more efficient than the average combined yields of the temperate oilseed crops such as soybean, rapeseed and canola. Despite this high productivity level only 1 Gl of biodiesel was produced from oil palm (Indonesia and Malaysia) in 2010.
Soybean is now widely processed to extract oil for biodiesel whilst co-producing soymeal for animal feed. The USA and Brazil together planted 55 Mha of soybean in 2010 producing 4 Gl of biodiesel. In practice, biodiesel production from soybean remains a by-product of the animal feed industry but as the demand for soybean as animal feed is predicted to grow strongly, biodiesel production from this source is also likely to increase.
Jatropha cultivation has been stimulated in many regions but there are doubts about its economic feasibility due to low yields.
The main raw material for wood pellets is sawdust but availability of traditional sawmill residues has decreased and difficulties in sourcing feedstock at competitive prices has resulted in a lower utilization by many pellet mills. Pellet producers have begun to source alternative woody feedstock, including wood chips from saw mills, round wood, residues, bark, used wood and wood from managed plantations. Demand for wood is currently met from around 30% of the world’s natural forest area. Many tree species are grown in managed plantations for bioenergy. Depending upon geographic location, primary softwoods include pines, firs and spruce whilst the main hardwoods are eucalypts, poplars and willows15.
2.2.2 Current Land Use
Between 2000 and 2010 the net ‘increased area’ (net of co-products) associated with biofuels was 13.5 Mha (24.9 Mha of which 11.4 was associated with co-products, hence approximately 13.5 Mha were required for biofuels production). This was allocated between bioethanol (6.8 Mha) and biodiesel (6.7 Mha). The additional area assigned to co-products is roughly 6 Mha for bioethanol (almost all dried distillers grains with solubles (DDGS) in the USA) and 5.4 Mha with biodiesel (mostly EU rapeseed and then US soy)16.
2.2.3 Current Conversion Technologies
2.2.3.1 Conventional Ethanol
Currently, 13.8 million ha of crop and around 200 mills comprise the maize ethanol system in the USA where dry milling is the dominant production process. The dry milling of maize grains allows enzymes’ easier access to starch for hydrolysis, producing glucose that is fermented by yeast to ethanol. Hydrolysis and fermentation can be conducted simultaneously allowing for increased efficiency. In the nineties most conversion plants were designed for beverages with 35 million L/yr capacity. Plant size doubled by 2005 and more than doubled again since 2005 resulting from efficiencies of scale and better integrated designs17. Current average corn ethanol production is around 4,000 L/ha18. Corn average yield in the USA is 9.9 ton/ha of grain standardized to 15.5% moisture 19.
| Box 2.2. Improving vehicle efficiency and fuel distribution logistics is needed for competitive deployment of bioenergy The main competitive issues between bioanalogues and the corresponding fossil fuels are production costs, distribution logistics and end-use efficiency. Some forms of bioenergy carriers can be more competitive than others depending on regional conditions. From a global point of view, liquid hydrocarbon “drop-in” biofuels are very attractive in terms of distribution logistics and existing equipment for end-use, but their energy cost is higher than that of their oxygenated precursors. In the past, the energy efficiency of ethanol vehicles was 16% higher than gasoline vehicles. Nowadays, the common technology applied to FFVs which are currently consuming about 15% of the available ethanol, is not fully exploring ethanol properties to avoid impairing gasoline operation. R&D combining direct-injection-downsized engines with turbocharging and variable transmissions has shown ethanol energy efficiency improvements of more than 10% over that of gasoline, for the same vehicle performance and without harming gasoline operation. The automotive industry and the fuel distribution infrastructure should both be stimulated to improve efficiency of ethanol usej. |
Around 4.8 million ha of sugarcane for ethanol and over 400 mills comprise the sugarcane ethanol system in Brazil where most commonly, a mixture of juice and molasses is used. The majority of mills are sugar mills coupled to distilleries, an operational synergy that allows for the easy switch from sugar to fuels production when necessary. Fermentation improvements have been attained in juice treatment, beer centrifugation, microbiological control, yeast treatment and recycling, and use of selected yeasts in fermentation. The prevailing system includes fed-batch fermentation with yeast recycling even though some continuous fermentation systems are in use20. Today, the average yield of the process is around 82 L of ethanol per wet metric ton of cane21. Current average sugarcane ethanol production is 7200 L/ha22. Sugarcane average yield in Brazil is 79.5 ton/ha fresh weight23. Using first-generation (1G) biofuel technologies, much less land is required to produce the same amount of ethanol when sugarcane is used as a feedstock as opposed to corn.
2.2.3.2 Ethanol and Flexible Fuel Vehicle Engines
The world fleet of 800 million LDV (Light Duty Vehicles) in 2010 is expected to reach a range of 1.7 to 2.1 billion cars in 205024. The use of ethanol as a transportation fuel is currently concentrated in USA and Brazil, but blends of 10-20% ethanol in gasoline have proven feasible in many countries and advanced automotive technology has expanded the conditions for using ethanol.
Currently, more than 75% of ethanol consumption in transportation worldwide is in the form of a low-level blend, limited usually to E10 that is used in gasoline vehicles. Mid-level blends (E10<EX<E40) represent approximately 10% of ethanol consumed in transportation worldwide.
Flex-fuel vehicles (FFVs) currently represent approximately 90% of sales of new cars in Brazil, and pure ethanol can be used nowadays by 23.8 million Brazilian vehicles (mostly cars with flex-fuel engines), which represent approximately 71% of the national fleet of light road vehicles. The US fleet included 14 million FFVs in 2013, of which more than 10% were using E85 (blends containing 51% to 83% ethanol, as lower levels are used during winter months to ensure cold starting)25.
2.2.3.3 Biodiesel
In 2011, 11.2 million hectares of land were used to produce biodiesel (6.7 Mha discounting the land used for co-products)26. Biodiesel is produced from oil seed crops like soybeans, rapeseed, canola, or from trees such as oil palm or jatropha through a transesterification process, by combining plant oil with a large excess of methanol and a catalyst (sodium or potassium hydroxide) to produce glycerol and a mixture of fatty acid mono-alkyl methyl esters (FAME) that is designated as biodiesel. About 50% of the biodiesel plants are smaller than 35 million liters per year capacity using a variety of waste feedstocks (e.g., used cooking oil, greases), while the other half ranges in size from 40 million to more than 150 million liters per year of capacity, using oil seed feedstocks, with the larger sizes being of integrated soybean production and biodiesel plants (e.g., Indiana, USA). European plants size tends to be smaller than in the USA because of feedstock availability. Current average rapeseed biodiesel production is 1300 L/ha. Rapeseed average yield in the EU is 3.1 ton/ha. Current average oil palm production is 4200 L/ha. Palm oil average yield in Malaysia is 18.4 ton/ha.
Globally, a large number of suppliers of smaller size production capacities range from one t/day to 500 times that, using various waste feedstocks such as animal fat, waste cooking oils and greases, and some of the non-food oils. Methanol as a reactant is one of the safety issues of production, principally in small-scale production where industrial standards for safety training may not exist. Biodiesel and customized oil compositions can also be made from sugars, using modified organisms including heterotrophic algae. Microalgae and cyanobacteria can generate fatty acids using sugars as feedstock from which biodiesel or other hydrocarbons can be derived. Ongoing research with these organisms aims to use brackish waters and land that does not conflict with food production, but will require improvements in engineering and reduction of costs before economically viable and sustainable systems are commercialized27.
2.2.3.4 Biodiesel Vehicle Engines
Biodiesel is primarily used as a 2% to 20% by volume blend with petroleum diesel. Biodiesel in blends will not separate or partition into water. In most vehicles, B5 and lower blends are approved, as long as the biodiesel meets D6751 and/or EN14214, the European biodiesel specification. The ASTM specification for conventional diesel fuel, D975, allows up to 5% biodiesel in conventional diesel fuel. A separate specification, D7467, describes the required property limits for B6 to B20 blends. Blends of B20 or higher are now accepted by most Original Equipment Manufacturers28.
2.2.3.5 Lignocellulosic Ethanol
The production of ethanol using lignocellulose as feedstock can use biochemical or thermochemical conversion approaches. In the biochemical route a pre-treatment of biomass is performed to separate the durable polymeric matrix of sugar-derived cellulose and hemicelluloses, and lignin, an alkyl-aromatic polymer, thus more difficult to process than grains or sugar crops. There are several leading pre-treatment options. Ethanol concentrations and rates vary depending on catalysts, temperature, and time, as well as reactor selection and process integration conditions. Additionally, pretreatment optimization conditions vary from one feedstock to another, thus generating many technology options and need for optimization. Various competing routes are under development. Considerable technical progress has been made and scaling up to commercial scales is underway but no industrial plant has operated yet at capacity. Energy balance and costs need to be improved. Integration of second generation (2G) with 1G ethanol production provides an option for fully renewable production of energy without the use of natural gas for thermal processes such as pre-treatment.
Biomass pre-treatments alone or in combination with hydrolysis lead to sugars that can be fermented to ethanol and other products. The most common application for the lignin is to process heat and electricity but additional products are being developed. Other biofuels that are also undergoing parallel technology development include other alcohols, syngas derived compounds obtained through gasification, microbial products using tools of synthetic biology, or fatty alcohols via heterotrophic algae in dark fermentation29.
2.2.3.6 Aviation Biofuels
Aviation biofuels have to be designed as drop-in fuels to be used with existing equipment and infrastructure that is highly regulated regarding safety and reliability. Other alternatives that imply novel power developments are not viable due to much higher costs.
International standards are in place and several pathways to aviation biofuels have been certified, but significant national, regional, and global level efforts will be required until technical confidence in a more diverse range of feedstocks and pathways for aviation biofuels is obtained. Multiple partnerships of airlines, airports, aircraft manufacturers, governments, biomass and biofuel producers and suppliers, and sustainability certification groups are leading these efforts.
The biomass gasification and catalytic Fischer-Tropsch upgrading pathway to synthetic paraffin kerosene received the first approval, because it is substantially identical to the commercial product based on coal gasification. HEFA (hydroprocessed esters and fatty acid) was approved for blends up to 50%. Since 2011, airlines collectively performed over 1500 commercial passenger flights with blends of up to 50% jet biofuel from used cooking oil, jatropha, camelina, and algae. A six-month commercial flight use study did not show adverse effects in the engines. The microbial pathway to farnesene was approved in 2014 for up to 10% blend. Other processes undergoing approval for commercial flights are in preparation and have produced sufficient fuels to start testing properties on the way to commercial flights30.
2.2.3.7 Renewable Diesel
Renewable diesel is a commercial hydrocarbon biofuel introduced in 2007 that reached 10% of biodiesel production by 2013. It is also referred to as “green diesel,” and includes HEFA, Hydrogenated Vegetable Oil (HVO) produced from fatty acids (fats, oils, and greases) or vegetable oils, or tall oil from trees. Current thermochemical technologies include hydroprocessing and hydroisomerization technology used in petroleum refineries, although various biochemical strategies are under investigation. The products consist predominantly of isoparaffins with some residual normal paraffins and proportions can be adjusted for diesel fractions or jet fuel fractions. Technoeconomic analyses and size of production are different depending on the feedstock and co-products31.
2.2.3.8 Bioelectricity
Electricity can be generated from biomass through direct combustion or conversion into gaseous or liquid fuels, such as biogas, syngas and bio-oil, which are subsequently combusted. The total contribution of bioelectricity represented nearly 83 GW of capacity, and 350 TWh of generated electricity in 2012. The contribution of bioelectricity in global renewable energy systems is expected to continue to grow from today’s annual 19% to 23% by 203532. Currently, roughly half of bioelectricity is used industrially and half is generated for municipal or residential use.
The introduction of advanced thermal cycles can increase the current efficiency (of co-generation processes) and almost double the amount of electricity produced33. One of the main barriers to co-generation projects is connection to the national grid. In Brazil, the connection cost has to be paid in full by the bioelectricity supplier and, in some cases, it represents 30% of the total project investment. In order to reach the potential, the country needs to establish a free or co-shared cost policy for building the bioelectricity transmission system34.
In 2012, bioelectricity from sugarcane was responsible for almost 3% of the total consumption of electricity in Brazil. The sugarcane and bioelectricity sectors need a long-term policy to stimulate investment in this power source35. The efficiency level could be higher, but at the expense of significant increases in costs36. The implementation and evolution in cane straw recovery will eventually lead to much higher levels of surplus electricity. However, there is a potential to reach 18% by 2020-2021. On average, the current levels of electricity surplus are around 10 kWh/t sugarcane and are expected to increase rapidly in the next years37.
In 1957, Mauritius was the first country where a sugar factory started to export bioelectricity to the grid (0.28 GWh). Since then, the amount of electricity co-generated by sugar factories from bagasse has been in constant progression.
2.2.3.9 Biogas
Biogas, a clean gaseous fuel, is an important clean-burning energy source for both developed and developing regions. Rural communities lacking access to conventional energy distribution specially benefit from biogas initiatives. Biogas is a mixture of methane and CO2 produced by anaerobic bacteria using organic waste (urban, agricultural or industrial) as feedstock. Biogas is about 60% methane and 40% carbon dioxide and the digester effluent has greatly reduced pathogens. Conversion to gas in family-size biogas plants allows 24% of the energy content in the dung and crop residues to reach the cooking vessel, while >90% of the nutrients and >80% of the humus are returned to crop-land38.
In the BRIC nations, China and India have embraced biogas, while Brazil and Russia have not. China has over 50,000 medium- to large-scale digesters and over 40 million household digesters. India has over 4 million household digesters and several large-scale projects. In both cases, government was critical to biogas adoption, lowering financial barriers and promoting usage39. In Brazil, with clean, centralized hydroelectricity, and Russia, with large supplies of natural gas, there has been little incentive to invest in biogas. Brazil has 22 biogas facilities. While there are plans to build biogas in Brazil and Russia, the projects face tough economics without clear policy supports40. The status of biogas in Germany, California, and the U.K., three regions with similar per capita GDP and energy use, is informative. All three regions began implementing agricultural biogas in the 1970s. Today, Germany has over 7,500 medium- to large-scale plants, more than three times the rest of the EU combined and nearly 40 times the U.S. Germany’s success can be traced largely to a steady drip of policy supports that started in 1991. Despite similar biogas potentials, California and the U.K. trail Germany with a little more than 1% of its capacity. Recent E.U. Directives, a desire to limit landfill, and a steady decline in offshore natural gas production have spurred the U.K. to begin biogas investment, establishing a feed-in tariff and other incentives41. While the California Energy Commission had assisted on-farm biogas installations in the past, changes in NOx emissions standards forced many to shut down, leaving farmers reluctant to reinvest. As a result, less than 1% of the state’s 1,600 dairies recover biogas from their herds42.
| Box 2.3. Decreasing lignocellulosic biofuel costs and commercialization are underway Multiple industrial-scale plants utilizing various configurations of biochemical conversion of lignocellulose into ethanol are being constructed and coming online worldwide. The higher costs, compared to corn or sugarcane ethanol, are typically related to pre-treatment and enzymatic hydrolysis processes due to high cost of enzymes. Alternatives that could eliminate the need for enzymes such as ionic liquids pre-treatments can be expensive and require very high recovery efficiency for low cost products. Enzyme costs though are being reduced. Wastewater treatment when acid or base catalysts are present can also increase cost. Some pre-treatments require corrosion resistant materials, thus increasing capital costs. The conversion of soluble sugars to ethanol is limited by the tolerance of fermentative organism against inhibitors (e.g., furfural or 5-hydroxymethylfurfural) produced during pre-treatment and by contaminating organisms. The discovery of new detoxification methods and the development of more robust fermentative organisms are addressing this problem. In one pilot-scale example, performance evaluation was conducted of various commercial cellulase and hemicellulase enzyme cocktails with organisms that can ferment both five and six carbon sugars. In industrial conditions, current enzymes costs contribution to lignocellulosic ethanol is seven- to ten-times higher than in the mature starch ethanol production. Costs are expected to decrease with increased operational time of industrial-scale plants and continued improvements in cocktails by enzyme manufacturers. Consolidated bioprocessing options are also in developmentk. |
2.2.3.10 Biogas Vehicles
Worldwide, there are about 17 million natural gas vehicles that could use upgraded biogas, including 1.7 million in Brazil, 1.5 million each in India and China, and 2.2 million in Argentina. In 2012, the International Energy Agency (IEA) projected a possible sixfold increase in use of natural gas in transportation by 203543. Because of the potential for fugitive and exhaust emissions of methane, these increases should be coupled with improved engine designs and emission controls.
2.2.3.11 Heat
Modern plants can provide heat to some 10,000 persons and local institutions using municipal waste, wood chips or bio-oil. In Norway, one such example has a power of 8 MW and the heat in the flue gas is recovered through condensing the water vapor, thus making each furnace effectively 10 MW. There are cleaning systems for the flue gas and the ash is collected from the bottom of the combustion chamber. The furnaces are used for base load and not operated during summer months when the demand is low. Three bio-oil burners, each 13 MW, use mainly imported bio-oil from rapeseed to cover peak demand during winter and low demand during summer. A gas burner, 1.5 MW, burns the gas that is piped down from the landfill but the gas has a low caloric value and the methane and CO2 content is rather low. The plant is also equipped with some 10,000 m2 of solar thermal collector panels for 7 MW additional capacity. In combination with a water accumulation tank, this heat can be stored for later use44.
More efficient cookstoves for solid biomass (e.g. wood or charcoal) are in development. It is important to recognize the need for a balance between efficiency and acceptability. While cookstove technologies now exist that are up to 90% efficient (in laboratories), they have a narrow tolerance to fuel size and moisture and thus generally require special care or pre-processing45.
2.2.4 Emissions
Acceptable bioenergy systems are those that lead to significant GHG emissions mitigation, while minimizing other environmental and social impacts. In the last five years, a deeper understanding of the life cycle analysis (LCA) issues in the evaluation of GHG net emissions from biofuels led to improved models and the search for better data (carbon stocks, iLUC, coproducts treatment, N2O emissions), changing significantly some earlier results (e.g., iLUC estimates). The complexity involving different feedstocks, regions, soils, local land use contexts, and conversion processes requires more data and still better analyses to provide sound support for policies46. Yet, there is strong evidence that when well managed, bioenergy can significantly contribute to climate change mitigation47.
| Box 2.4. Evidence increasingly indicates the need for value-added co-products to establish the cellulosic ethanol industry Traditional lines between biochemical and thermo/chemical catalytic conversion will continue to be significantly blurred with the development of processes combining aspects of biological, catalytic, and thermal treatments of biomass to produce renewable transportation fuels. Industrial development utilizing genetically modified yeast and bacteria to convert cellulosic biomass into high-value end products in a single step that combines hydrolysis and fermentation is underway. Development of fuel and chemicals as applications for antibiotics and other medical uses is continuing. Lignin conversion to chemicals and materials also offers potential additional value streams for an integrated biorefinery, with a range of possible renewable aromatics, which are common building block molecules produced currently from fossil fuels. If high throughput plants can be mass produced at small to medium scales, their environmental footprints could become smaller and the cost may be reduced sufficiently for chemicals applications. Supercritical water processing to rapidly solubilize in two stages five-carbon sugars from six-carbon sugars is being tested at small scales. This thermo/chemical pre-treatment can be coupled with a variety of chemical catalysts to produce drop-in hydrocarbon fuels. Integrated catalytic upgrading can lead to hydrocarbons in the jet, diesel, and gasoline range in addition to other chemicals also undergoing development and commercializationl. |
As awareness of the evidence that combustion of fossil fuels is causing climate change has expanded, bioenergy has come to be seen as a mechanism for decreasing the carbon intensity of energy use. Approximately 50 countries now have biofuels mandates driven by their need to reduce emissions48. When done right, biofuels can contribute to significant decreases in emissions relative to fossil alternatives. Emissions should be calculated in an integrated framework that considers all mass flows including co-products. A recent and highly detailed well-to-wheels analysis of life cycle GHG emissions concluded that relative to the use of petroleum, ethanol from maize grain, sugarcane, maize stover, switchgrass and Miscanthus would reduce emissions by 19–48%, 40–62%, 90–103%, 77–97% and 101–115%, respectively49. Biodiesel provides 30–60% mitigation (no LUC considered).
LUC GHG emissions of oil seeds based biodiesel are subject to great debate, varying from 34 to 62 g CO2e/MJ50. The iLUC effects are usually calculated through the use of economic market equilibrium models. With respect to corn ethanol production, the initial LUC effect of US corn ethanol was proposed as 104 g CO2-equivalent (CO2e) per megajoule (MJ) (for reference purposes, the emission factor of gasoline is 92 g CO2e/MJ). Various model improvements re-estimated LUC related GHG emissions that decreased to 32 g CO2e/MJ and more recently to 15 g CO2e/MJ. Significantly lower values for corn ethanol (e.g. 7 g CO2e/MJ) have also been found51.
Because of methane’s high GHG multiplier (CO2e = 34 over 100 years; 86 over 20 years52), fugitive methane emissions can also be a problem in biogas systems53. In addition to possible leaks in collection and transmission, when the gas is used in lean burn internal combustion (IC) engines for transportation or electricity generation, the combustion kinetics allow two to three percent of the methane to escape in the exhaust54. These methane emissions are often not regulated for stationary sources. If the IC engines operate with stoichiometric air/fuel mixture, methane presence in the exhaust is not significant.
2.3 Bioenergy Expansion
2.3.1 Land Availability
Is there enough land available to sustainably produce food, feed and biomass for energy for a growing population? Some argue that due to anticipated low rates in yield improvements food demand will outstrip production by 30% over the coming 35 years, requiring an additional 130-219 Mha of agricultural land. Estimates of net land demand for biofuels based on observation of the 34 largest biofuel producing countries, which accounted for over 90% of global production in 2010, indicate that the increase in biofuel production (2000 to 2010) resulted in a gross land demand of 25 Mha out of a total of 471 Mha arable land. However, nearly half the gross biofuel land area was associated with commercial co-products (primarily animal feeds, e.g., distillers dry and wet grains, soy and rape meal) leaving a net direct biofuel land demand of 13.5 Mha (2.4% of arable land area). Despite this increased demand for land for biofuel feedstock production, overall there was a decline in agricultural land area of 9 Mha in the countries evaluated. Increasing cropping intensity was found to have more than compensated for the decline55.
A gross land demand for modern bioenergy was estimated at between 50 Mha and 200 Mha by 2050. Whilst highly uncertain, this scale of land use would deliver between 44 and 135 EJ/yr of modern bioenergy in 2050. Approximately 0.7 EJ per Mha is a reasonable ballpark land use intensity for production of modern bioenergy at this scale in the 2050 timeframe56.
Potentially available land for bioenergy expansion is exclusive of anticipated demands for cropland, natural forests and forest plantations, urban land (including allowance for expansion), and increased land for biodiversity. One major opportunity to compensate for growth in biomass resource use is to intensify the use of low productivity pastureland and make use of (part of) the available area of pasture, which is estimated to be around 950 Mha, for multipurpose agriculture. Pastureland makes a small contribution to global supplies of dietary protein and calories, and in many regions productivity is low due to lack of management and inputs. In such locations, pasture intensification to generate surplus land for bioenergy may be much simpler and offer comparatively greater benefits than the conversion of cropland. For sustainability reasons it is also recommended to use marginal, low productivity lands coupled with bioenergy crops that can adapt to poorer soils and rainfed conditions.
At a global level, land is not a constraint.
Land available for rainfed agriculture is estimated to be 1.4 Bha of ‘prime and good’ land and a further 1.5 Bha of marginal land that is ‘spare and usable’. Around 960 Mha of this land is in developing countries in sub-Saharan Africa (450 million ha) and Latin America (360 million ha) with much, if not all of it, currently under pasture/rangeland57. There is also a sizable potential in the US58,59. The critical question is not one of managing a competition for land between energy and food, but rather whether and how bioenergy production can be gracefully incorporated into human and natural systems.
These current estimates for the land demand of bioenergy are lower than other estimates because of the inclusion of key factors supported by recent analysis: (1) the ability of bioenergy to recycle biomass through the use of wastes and residues, (2) crop yield growth supported through investments in infrastructure and (3) development of capacity in agriculture and forestry. Furthermore, the potential to use alternative crops and in particular to increase the area of perennial cropping will diversify agricultural landscapes and provide novel and productive tools to manage and ameliorate the impacts of intensified food cropping60.
2.3.2 Biomass Production Potential
While traditional bioenergy is derived from a wide variety of tree species and crop residues, currently only a few crops supply the bulk of biofuel production globally. Of the four largest sources of biofuels, maize and sugarcane (bioethanol), soybean and rapeseed (biodiesel), sugarcane appears to be best poised for substantial growth in the future. Many other areas of the globe would be suited to replicate Brazil’s success in developing an environmentally and economically sustainable sugarcane bioethanol industry. Because of projected increases in demand for food, the continued use of maize for biofuel may depend, in the long-run, on the rate of yield improvement for regions in the world outside the USA61.
Taking account of the need to protect the Amazon, conserve biodiversity and avoid conflict with food production, the Brazilian government has mapped 63.5 Mha suitable for sugarcane production. This would not require the clearance of natural ecosystems, but would require significant expansion onto pasturelands, largely in the Cerrado region, with low stocking density. This would need to be compensated by improvement of the remaining pasture to support an increase in the number of head per hectare. This land area could allow the production of 800 Bl of ethanol by 2030, which in energy terms would be equivalent to 15% of total global liquid fuel use in 2009, while the bagasse could provide 30 GW of electricity. This expansion of sugarcane production is likely to be incentivized by the uncertainties in petroleum prices and by climate change driving a demand for biofuels with low net GHG emissions. However, it will require the development of new varieties capable of production under marginal, warmer and drier environments, as well as substantially different soils. Maintaining yield in these new areas will be important to minimizing land demand62.
Many crops and even as yet undomesticated plants, have the potential to become important feedstocks. Lignocellulosic biomass in the form of energy crops, agricultural wastes and forest residues represents the most abundant source of renewable biomass with production of 1010 metric tons on an annual basis, which is about half of the biomass produced in the world. This resource is widely recognized as the primary future feedstock for the biofuel and bio-based industry; it could produce up to 442 billion liters of bioethanol per year due its high diversity around the world63. Although many plant species can be used for production of lignocellulosic fuels, Miscanthus, a C4 perennial grass, and a close relative of sugarcane, has attracted particular interest as a promising resource for use as both solid combustion fuel and as a feedstock for liquid fuels given its high yield potential, low requirements for soil tillage, weed control and fertilization as well as the long crop cycle of up to 25 years64.
While it is anticipated that a range of herbaceous perennials could become viable sources of biomass on land unsuited to food crops, this is already an established fact for the many pulp and round wood supply operations that meet ISO 14001 sustainability standards65.
| Box 2.5. Recuperating soils with bioenergy There is enough land available for substantial bioenergy production and increased food demand, considering impacts of global change affecting crop production, yield increase predictions, and preservation for urban areas, forestry and protected land. This land is concentrated in Latin America and Sub-Saharan Africa (over 900 Mha rainfed land available), and presently used predominantly for low intensity grazing. Developed countries also have land available but the agricultural area is expected to remain stable. In addition, there is about 607 Mha of farmland available that have become degraded. Not only can degraded and marginal land be used for bioenergy feedstock production, but in doing so, the land can be rehabilitated and improved, providing a positive impact on soil qualitym, soil carbonn, productivity and again on food security. Long before the world reaches any significant fraction of 200 Mha devoted to modern bioenergy, we will have ample opportunity to be guided by experience rather than projectiono. |
In 2006, global production of wood pellets was between 6 and 7 Mt worldwide (not including Asia, Latin America and Australia). In 2010, it reached 14.3 Mt or 0.26 EJ (including these countries) while consumption, predominantly for biopower, was close to 13.5 Mt, representing an increase of more than 110% in 4 years. Production capacity from pellet plants has also increased worldwide reaching over 28 Mt yr-1 in 2010. The European Union is the main market for wood pellets, but the gap between
European production and consumption has grown to become 8 fold66. Organic post-consumer waste and residues and by-products from the agricultural and forest industries, which contribute a major part of biomass for energy today, will not suffice to meet the anticipated levels of longer term biomass demand. Thus, much of the bioenergy feedstock will have to come from dedicated production. Meeting future demands of wood will require investment in energy tree breeding and enabling policies that tackle the environmental concerns surrounding forest management, new plantings and residue removal. The claims that large-scale microalgae production will meet future energy needs have not been substantiated67.
Meeting future energy needs with high productivity perennial feedstocks, both woody crops and grasses, will require expansion of agronomic research and breeding trials on marginal land and land unsuited for food crop production. A broader conceptualization of multipurpose agriculture will also require an improved definition of land suitability classes, including land unsuited to food crop production68.
While much of the focus of feedstock research has been on biomass crop production, cost effective delivery of feedstocks also requires improved logistics. Biomass harvesting, collection, baling, transport, drying, storage and pre-treatment should all be efficiently and cost-effectively designed to enhance the overall sustainability of bioenergy projects. Except for some large-scale commercial crops such as sugarcane or corn, biomass supply chains for bioenergy production are currently underdeveloped. Significant improvements could be achieved by modernizing the logistic operations to make them more efficient. Capitalization, replication or adaptation experiences could be derived from the existing commercial biomass supply chains. Modern biomass supply chains offer significant possibilities for gathering all types of biomass and synergizing their physico-chemical properties with subsequent energy conversion processes69.
2.3.3 Bioenergy Costs
Cost trends of commercial biofuels and bioenergy were reviewed for many countries and expressed as levelized cost of biofuel—a function of feedstock cost. For biodiesel, the oil feedstock costs contribute 80% to 90% of the estimated production cost, unless derived from wastes. For ethanol from corn and sugarcane, the feedstock contributed 60% to 80% of the cost70. Multi-biomass utilization costs (biomass co-firing or co-combustion) for simultaneous use of straw and reed canary grass was investigated and a 15–20% cost reduction was obtained simply by using the two biomass sources instead of one 71.
The 2012 ethanol prices in Brazil and U.S. are shown72. The Brazilian government has held the gasoline price at the refinery gate (ex-taxes) at approximately 70 US$/barrel for the last 5 years, significantly below the international parity prices formerly adopted. In Brazil, taxes have historically represented more than 40% of the final price of gasoline73.
The capital costs of advanced biofuel conversion technologies are currently estimated at factors of 4 to 5 higher than commercial ethanol plants, so capital cost will contribute more to the cost of advanced biofuel production cost, depending on the conversion plant size, among other factors74. Stable policies become even more important when capital costs are a large part of the fuel price.
Projections from linked models of feedstock production, logistics with pre-processing, and conversion techno-economic analysis of advanced conversion for the nth plant indicate a decrease in the minimum ethanol selling price of around 10% as a refinery scales up from 2000 to 10000 Mg/day, while increasing the GHG emissions intensity by about 16% for corn stover. Estimates of economies of scale for switchgrass indicate similar decreases for that feedstock75.
Biofuels costs were estimated for 2012, projected for 2020 and compared to fossil fuel costs in an analysis of more than 15 lignocellulosic biofuel plants planned to be online within the next few years76. Compared to today’s estimated production costs, significant improvement is possible in both the enzymatic hydrolysis and thermochemical lignocellulosic ethanol pathways. By 2014, in industrial conditions, enzymes cost contribution to lignocellulosic ethanol is described by industry as sevento ten-times higher than in the mature starch ethanol production; costs are expected to decrease with increased operational time of industrial-scale plants and continued improvements in cocktails by enzyme manufacturers. Similarly, the thermochemical routes for hydrocarbon fuels are also expected to reduce their costs77.
2.3.4 Biomass Supply in the Face of Climate Change
The median of studies78 indicate that climate change will cause a 0 to -2.5% decline in maize and wheat yields per decade and none in rice and soybean. This appears small in relation to historic rates of yield improvement per decade in these crops. But there are several caveats in relation to a range of conditions that may on balance become more common, like extreme weather events and altered pest and disease incidence. Tropospheric ozone, which is today some ten times pre-industrial levels, is already estimated to cause yield losses of around 10% in these crops and levels may increase by increasing temperatures and nitrogen oxide emissions, especially in Southeast Asia. By contrast empirical field scale enrichment of CO2 to anticipated 2050 levels increased the yield of rice, wheat and soybean (C3 crops) by about 15%, but did not affect maize (C4) yield79. The development of perennial grasses and coppice systems could provide resilience for regions facing heavier rainfall and erosion under climate change. Similarly, exploration of alternative energy crops for semi-arid regions could improve the adaptive capacity of bioenergy systems.
| Box 2.6. The use of pastureland marginal lands provides an important economic potential Increasing animal stocking densities to currently-attainable, climate appropriate levels, would allow existing pastureland to support 3.8 fold more animals. Bringing the poorest-performing pastures up to 50% of their maximum attainable density would more than double the global stock of grazing animalsp. Actions to improve pasture conditions, along with livestock production intensification, can effectively make large amounts of land available for alternative usesq. Gross estimates of the potential for energy crops on possible surplus good quality agricultural and pasturelands range from 140 to 290 EJ/yr (surplus ‘Very Suitable’ and ‘Suitable’ land at 10 and 20 odt ha-1 yr-1)r. The potential contribution of water-scarce, marginal and degraded lands could amount to 80 EJ/yr (‘Moderately’ + ‘Marginally Suitable’ Land; 5 odt ha-1 yr-1)s. For example, saline soils could support as much as 50 EJ of biomass for energyt. Arid lands cover 30% of the Earth’s land surface and could be used to produce agave for ethanol productionu. |
2.3.5 Impacts of Bioenergy Expansion on Biodiversity and Ecosystems
The effects of biofuel feedstock production on biodiversity and ecosystem services are context specific, and need location-specific management80. Policies addressing environmental impacts of bioenergy should be informed by assessments specific for the location, rather than relying on average/generic data and simple footprints and efficiency metrics81. Sustainable biofuels and biodiversity management requires cross-sectoral integrated planning and regular monitoring of selected, cost effective and policy relevant indicators. Cost effective, landscape-level biodiversity indicators are in development but await application over most of the developing world82.
Conservation of priority biodiversity is paramount; management practices in biofuels production should aim to minimize threats83.
Much attention has been given to the use of biodiverse systems for expansion of bioenergy production, with the concept that they could serve both biodiversity and production. However, analysis of this land sharing concept finds that because of the large areas required by these less productive systems, for most areas of the globe, high productivity monocultures are ironically more effective for biodiversity by sparing land through high productivity. For example, mixed-grass prairie would require 6x the land area of an unfertilized Miscanthus system to deliver the same amount of bioenergy84. In addition to the land spared by highly productive monocultures, expanded use of energy crops within conventional agricultural cropping systems can also improve diversity through integrated agroforestry systems, establishing perennials on fragile parts of the landscape, and using winter energy crops to complement summer annual food crops in temperate climates.
Today, many regions of the world are under water stress due to population growth or climate change. Climate change may impinge on water resources in uncertain ways and decrease crop yields. Water availability may change geopolitics in ways similar to oil in the last century. Water availability can become a major limiting factor for bioenergy expansion in some regions.
Landscape-level optimization of bioenergy, especially perennial and woody systems, can reduce soil erosion, improve water quality, allow nutrient recycling, and promote
carbon sequestration in soils85.
2.3.6 Indirect Effects
In addition to the direct effects of bioenergy production on prices, trade, land use and emissions there may also be indirect effects. Two important indirect effects are the indirect land use change effect (iLUC) and the rebound effect. iLUC is the change in land use outside a feedstock’s production area needed to replace the supply of that commodity and that is induced by changing the use or production of that feedstock86. The rebound effect87 studied in the field of economics, recognizes that substitution of fossil resources by biomass decreases the demand for fossil resources and therefore induces a lower price. A lower price leads to higher fuel consumption in other markets, which partly offsets the initial fossil fuel and GHG savings. In the context of mitigating climate change, model improvements in estimates of iLUC allowed for a downward revision of the initial GHG estimates of 104 g CO2-equivalent (CO2e) per megajoule (MJ) of US corn ethanol to values as low as 7 g CO2e/MJ. For comparison, the emission factor of gasoline is 92 g CO2e/MJ. Model improvements consisted of factors such as improved data, increased spatial resolution, including pastureland as an option for conversion to bioenergy production, crop yields on existing agricultural land and newly converted land for agricultural and bioenergy crops, treatment of co-products for animal feed, and the modeling of wood products (including by-products and the fraction of carbon that is stored for a longer period). Rebound effects which are proposed to be caused by increased fuel consumption due to a lower induced oil price, are crucial for the renewable energy policies being effective in reducing GHG emissions, yet are presently under-researched and appear to be dependent on policy. The likely range of the change in GHG emissions with the average iLUC effect is -1.2% to 0.4% under the Renewable Fuels Standard, -1.9% to -3.3% under the proposed national Low Carbon Fuel Standard, and -3% to -5.3% under a US$ 60 per-metric-ton carbon tax policy relative to US GHG emissions over the 2007-2030 period88.
2.3.7 Financing
Estimates of subsidies to fossil fuels are in the range of US$ 500 billion to US$ 1 trillion per year. Global subsidies (for renewables based electricity production and biofuels) had a value of more than US$ 60 billion in 2010 and are anticipated to rise to almost US$ 250 billion in 203589. Recent studies show that US$ 270 billion/yr for innovation on land use, energy and cities, makes it possible to finance a reduction of 50-90% of the GHG emissions needed by 2030 to avoid a 2 OC increase in global average temperatures90.
2.3.8 Trade
Wood is the fifth most important product in world trade. The market in wood based products increased from US$ 60 billion to US$ 257 billion in the 20 years up to 2008 and is estimated to be US$ 450 billion by 2020. In 2008, global wood usage amounted to around 4.6 billion cubic meters.
Net global bioenergy trade of wood grew six fold from 56.5 PJ (3.5 Mt) to 300 PJ (18 Mt) between 2000 and 2010. Europe remains the key region for international solid
bioenergy trade, accounting for two-thirds of global trade in 2010. The European Union is the main market for wood pellets, of which 81% is currently met by the European pellet industry, however the gap between European production and consumption has grown to more than 8 fold. In comparison with pellets, currently less than 10% of annual trade in woodchip is bioenergy-related91.
The global trade of liquid biofuels has also increased in the last decade. Fluctuations in trade flows have been heavily influenced by policies and changes in production. For example, facing a blend wall of 10%, the US exported 620 million gallons of corn ethanol in 2013 (mainly to Canada). Ironically, the US imported 242 million gallons of ethanol from Brazil to meet greenhouse gas reduction requirements in the advanced biofuel portion of the revised Renewable Fuel Standard. Sustainability standards also have affected imports of biodiesel from different feedstocks into the EU. It is likely that global trade of biofuels will remain dynamic as economic and policy environments continue to evolve.
2.4 Bioenergy Added Benefits to Social and Environmental Development
2.4.1 Biomass Carbon Capture and Sequestration
The direct CO2 emissions from biomass combustion broadly correspond to the amount of atmospheric CO2 captured by photosynthesis through the growth cycle
of feedstock production, while ethanol fermentation releases about half the carbon captured by photosynthesis as nearly pure CO2. Recovering this CO2 from biopower or biorefinery facilities would therefore result in a net removal of atmospheric CO2, once the direct emissions are sequestered and stored using carbon capture and storage (CCS) technologies. As a consequence, a combination of bioenergy and CCS (called BECCS) generally will result in net negative emissions92. Because photosynthesis captures CO2 at atmospheric concentrations, BECCS could be valuable for reaching lower concentration levels, and offers one of the few practical strategies to address the potential that global emissions will overshoot beyond target concentrations (e.g. 600 ppm)93.
The use of BECCS is constrained by the potential for CCS and biomass supply. Capture from combustion exhaust is technically challenging and current approaches are expensive, so power plants fired with biomass and including carbon sequestration do not actually exist today. However, current corn biorefineries already use the wet stream of pure CO2 by drying, compressing, and delivering through pipelines to commercial applications (carbonated beverages, freeze drying, etc.), and also commercial
enhanced oil recovery for facilities in close proximity. This part of the technology is currently being coupled with CCS technologies at a corn ethanol refinery in the USA. This project has completed pilot demonstrations and is permitted to sequester CO2 emissions to onshore deep saline formations in the Illinois Basin at over 1 MtCO2/yr capacity, with extensive performance testing and monitoring over time.
All bioenergy technologies that emit streams of CO2 as a product are part of the BECCS family of technologies, with potential to sequester atmospheric CO2 producing negative emissions, which could become important strategies in climate change mitigation if proven. The larger the scale and the proximity to appropriate geologic storage sites, the more likely the technologies are to be used. Both the U.S. and Brazil have appropriate geologic sites in proximity of current biorefineries94.
| Box 2.7. Crop yields: biotechnology and cropping intensification as options to increase supply Projections for 2022 crop production in Brazil show considerable production increases across most of its main agricultural products. Growth in agricultural production is expected to be on productivity gains (yield and cropping intensity) rather than area expansion. Total grain crop production (soybeans, corn, rice, beans, wheat) is expected to increase 21.1% with an area expansion of only 9%. Although most sugarcane production increase is accounted for by expansion of the planted area, yield per hectare has also doubled over the last 50 years. Using conventional breeding to increase the energy content of new sugarcane varieties has been projected to potentially increase Brazil’s sugarcane bioenergy yield to 1,228 GJ ha-1 yr-1 over the next 20 yearsv. On the other side, climate change can alter biomass production for some crops and hinder yield gains. There are new prospects for greatly increasing the yields of energy crops, but they require the use and acceptance of genetic engineering, which has contributed significantly to yield improvement in maize and other crops over the last decade. Breeding for resource-use efficiency (water-use and nitrogen-use efficiency) and “future climate-resilient” bioenergy crops should be stimulated, including tolerance to drought, water logging and salt accumulation. Using biotechnology maize production in the USA has achieved impressive yield gains but in other parts of the world maize yields are low. Sugarcane and perennial energy crops are far from theoretical yield potentials. Efforts are under way to use marker-assisted breeding and conventional approaches or the GM route for energy crops biotechnological improvement including perennial grasses and woody plants. These include not only increased yield and adaptation to the environment but also tailor-making biomass chemical composition to different applications including increased saccharification for second-generation biofuels. |
2.4.2 Improvement of Soil Quality
Bioenergy crops that efficiently use nitrogen (N) fertilizers usually have a better carbon footprint than annual food crops. There are several crops employed in biofuel production that present such characteristics. Sugarcane can have dry matter yields above 30 t ha-1 with only 30 to 120 kg ha-1 of N fertilizers; eucalyptus and other woody plants also have almost similar performance. Miscanthus, depending on when it is harvested, translocates most nutrients from the above ground plant parts to the roots and rhizomes before harvest, thus preventing excessive removal of N from the field and reducing the need for fertilization95.
The recycling of corn stover residues into the field is required to not only protect against wind and water erosion but also sustain soil organic matter (SOM) because of its effect on aggregation, soil structure, water entry and retention, nutrient cycling, and biological food webs. An average of 5.25 or 7.90 Mg ha-1 of corn stover should be left in the field to sustain SOM for continuous maize or maize-soybean rotations. Assuming a 1:1 dry grain to dry stover ratio, these guidelines mean that continuous maize fields yielding 8.5 Mg ha-1 (160 bu ac-1) of grain could sustainably provide an average of 3.25 Mg ha-1 (1.25 ton ac-1) of stover96. It was estimated that soil quality could be maintained if 50% of the stover were removed97. Since 2008, coordinated, multi-location field trials have added 239 siteyears of data from 36 replicated field experiments, to help make the general guidelines more site specific. Those studies had grain yields ranging from 5.0 to 12.0 Mg ha-1 and showed N, P, and K removal increased by 24, 2.7, and 31 kg ha-1, respectively, with moderate (3.9 Mg ha-1) stover harvest or 47, 5.5, and 62 kg ha-1, respectively, with high (7.2 Mg ha-1) stover harvest. The field studies also quantified removal effects on SOM, microbial communities, trace gases, economics, and other factors98. Since the effect on fertility will depend on the absolute amount of stover, the proportion that needs to remain could arguably become progressively smaller as yield rises. However, if we assume a fixed removal of 50%, then by 2030 this would amount to 228 Mt, and at an estimated 380 liters of ethanol that could be produced from the cellulose and hemicellulose in a dry metric ton of biomass, this would provide an additional 86.6 BL of ethanol99.
Perennials radically reduce rates of erosion and nutrient runoff as compared to conventional tillage, often by over 100-fold, and are widely recognized as leading management strategies to achieve these objectives100. Perennial and semi-perennial systems (i.e. crops with multiyear rotations) offer several benefits to soil. In parts of the USA, soil loss could be reduced by 60% if switchgrass was grown for bioenergy instead of corn101.
Recycling of nutrients can improve soil quality and decrease the need for fertilizers. The iconic example of fertirrigation is the use of vinasse, a by-product of ethanol
fermentation, with a high biological oxygen demand (175,000 mg L-1), containing around 3-6 g L-1 of organic carbon and 2 g L-1 potassium as well as other nutrients. About 10 to 13 L of vinasse are produced for each liter of ethanol, around 300 billion L yr-1 from sugarcane in Brazil alone. Vinasse became an important, cost-effective nutrient source, potentially providing 2.45 kg/t in K2O savings, replacing use of fertilizers derived from fossil sources102.
2.4.3 Increasing Soil Carbon
Switching of food crops into bioenergy crops can increase soil carbon but the opposite may be true if bioenergy crops substitute forests or peatlands. Different cultures and different managing practices have different payback times. Replacement of tropical peatland forest with oil palm incurs a carbon debt ranging from 54 to 115 Mg CO2eq ha-1 yr-1, varying by site and also by the accounting time frame. In contrast, soil organic carbon (SOC) under oil palm may equal or exceed native forests over time in some locations103. Some 150 years of cultivation of the rich cornbelt soils is suggested to have resulted in the loss of about 50% of the carbon in the top 15 cm of soil104. Correcting for the carbon removed in the harvest, it was shown that in side-by-side fields of the same maize cultivar under no-till there was a net accumulation of 1.6 t C ha-1 yr-1 while the tilled field showed a net loss of 0.2 t C ha-1 yr-1 to the atmosphere105.
| Box 2.8. Water use in bioenergy processes has been decreasing In the production of biofuels, water intensity indicators are not sufficient to guide decisions and must be complemented with other metrics and evaluation frameworks. The water intensities (or water footprints) of biofuels reported in the literature vary by orders of magnitudew. Though widely adopted, the methodology for such reporting is not standardized, not validated by measurement, and marginally useful for determining ecosystem impact. Some footprints include rainwater inputs, theoretical transpiration losses from plant growth, and in some cases theoretical use of irrigation water. Some include additional water volume as a proxy for water quality impacts. Water use is not consistently allocated when multiple products arise from a particular feedstock. However, the recently completed ISO water footprint standard (ISO 14046) is intended to improve consistency in quantifying water footprints. Nonetheless, it is important to note that over the years, innovation in maize production and processing improved ethanol process water use by a factor of 2. In the nineties, each liter of ethanol used six liters of water in the process. By 2007, only three liters of water were used and by 2012, water use decreased by 10% (2.7 liters of water per liter of ethanol)x. Sugarcane cultivation in the Center-South of Brazil does not require irrigation. In case of water deficit during drought conditions it is possible to use residual water from the mills. According to UNICA and the Cane Technology Center (CTC) 93.5 m3/ha of water can be recycled for agricultural use. Of the estimated 22 m3 water/ton of sugarcane required for industrial processes less than 2m3/ton comes from resources indicating more than 90% of the water used is from reutilization. Investments continue to be made and in less than 3 years the water needed for each ton of sugarcane was reduced by 20%. |
Several studies have found that growing perennial grasses in lieu of ow crops increases soil carbon stocks at a rate of 1 Mg C ha-1 yr-1 or more for an extended period of years. Similar outcomes have recently been found for sugarcane when it replaces soy or pasture in Brazil. An increase of 1 ton C/ha in the soil carbon pool of degraded cropland soils may increase crop yield by 20 to 40 kilograms per hectare for wheat and 10 to 20 kg/ha for maize106. Deep-rooted perennial bioenergy feedstocks in the tropics could enhance soil carbon storage by 0.5 to 1 metric ton ha-1 yr-1 on already cleared land107. Switchgrass’ below ground biomass can be eight times higher than the above ground biomass and it produces 55% more total soil organic carbon than corn/soy bean over two rotations108.
2.4.4 Pollution Reduction
The environmental performance of the commercial ethanol industry has improved with time. Most pollution associated to bioenergy is derived from biomass production with phosphorus contained in the fertilizer being the major source.
The conversion process of conventional biofuels has minimized emissions, energy input and water use. Conversion contributed over time to a smaller fraction of the life cycle impacts across the value chain and this trend was mostly associated with power generation.
Corn ethanol in the U.S. has lower ozone layer depletion and particulate matter emissions than gasoline but higher impacts in acidification, eutrophication, photochemical oxidation; and decreased global warming potential (GWP). Sugarcane ethanol in Brazil presents lower impacts than gasoline in terms of GWP, fossil depletion, and ozone layer depletion; higher impacts in acidification, eutrophication, photochemical oxidation, and agricultural land use categories. Human health toxicity values are similar to gasoline.
In terms of tailpipe pollutant emissions, data indicate that automakers can achieve regulatory limits with FFVs, independently of the fuel being used. Present Brazilian emission regulations allow subtracting the unburned ethanol from Non-Methane HydroCarbons (NMHC) to avoid gasohol injection during the cold phase cycle. Upcoming regulations will probably incorporate the Non-Methane Organic Gases (NMOG) concept to limit total volatile organic compounds (VOC) and the potential to form ozone. The use of higher levels of ethanol in FFVs does not seem to imply any significant increase in emissions, with the exception of acetaldehyde and formaldehyde. Even though there is an important increase in these aldehydes, the total air toxic emissions potency, which considers also 1,3 butadiene and benzene and EPA toxicity equivalence factors, is significantly smaller when operating with higher levels of ethanol109.
Biodiesel may cause a small increase in emissions of NOx relative to petroleum diesel, by about 2% for B20 in some cases but not always. For more modern engines equipped with diesel particle filters, diesel oxidation catalysts, and NOx emission control catalysts there is little if any effect of fuel on tailpipe emissions110.
2.4.5 Social Benefits
Around three billion people in the world rely on solid fuels for cooking, whose consumption produces a number of very negative health impacts111. Indoor pollution from inefficient cooking stoves results in the premature mortality of nearly 4 million women and young children every year112. In Africa and India more than 10 percent of children under the age of 5 suffer from acute respiratory illness associated with biomass smoke113.
Over 1.2 billion people (nearly 17% of global population) have currently no access to electricity while another 2.8 billion people rely mainly on the use of traditional biomass for energy (cooking and heating). Around three-quarters of the world’s population depend directly on agriculture and therefore the links of this sector with poverty reduction possibilities should be considered, such as by making use of agricultural residues for energy that can have positive spinoffs for food preservation, mobility and other energy services. At the same time, there are roughly 2.7 billion people living under a budget of US$ 2.00 per day who are considered “poor” by international agencies. They lack adequate access to infrastructure, which gives rise to the wide dependency on traditional biomass to meet their energy needs. Most live in rural areas in developing countries where the lack of access to electricity and modern fuels is also associated to food insecurity.
There is growing evidence that bioenergy production in poor rural areas can help improve economic growth, job security, market development, food quality and security. The world’s gross employment in the biofuel sector was over 3.5 million in biofuel for transport and renewable energy for transport, with an estimated 1.5 million in first generation biofuels114.
| Box 2.9. iLUC emission estimates have decreased Since 2008 when first numbers on iLUC were published, improvements on the methodologies have been made. First numbers published were based on the assumption that 1 hectare of land converted to any feedstock for bioenergy production would necessarily needed to be compensated by the conversion of 1 ha of native vegetation, leading to a high carbon debit associated to bioenergy. Factors such as yields improvement, conversion of low productivity pastureland, multi-cropping and double-cropping, intensification, integration and substitution among agricultural markets, production of co-products, use of residues, deforestation reduction in developing countries, were ignored. Recognizing the complexity of agricultural systems, and the unrealistic assumptions made in the beginning, global models and parameters have been improved to provide better estimates for the iLUC effects. Incremental knowledge accumulation has changed the results. iLUC factors for sugar and starch crops have been estimated by different models, with comparable assumptions and scenarios, and over the years a downward trend in iLUC emissions is observed. Improvements implemented in the models, to allow them to account as much as possible to the complexities of the agricultural systems and markets led to reductions in iLUC factors in the last 7 years. From the initial GHG estimates of 104 g CO2- equivalent (CO2e) per megajoule (MJ) of US corn ethanol, with improved models values decreased to as low as 6 g CO2e/MJ. For comparison, the emission factor of gasoline is 92 g CO2e/MJ. In the case of sugarcane estimates decreased from 111 to 13.9, almost a ten-fold decrease. On the oil-bearing crops, the iLUC factors are higher than sugar and starch crops. This is due to: – Palm oil expansion being until nowadays strongly based on tropical forest or peatlands conversion, although efforts exist to improve yields rather than land conversion. – The structure of the edible oil markets and several similarities of different oil types (soy, rape, pail oil, sunflower), the demand for edible oil being on the rise, and palm oil being more competitive, any additional demand possibly leading to increased palm production. |
1 (Chapter 3, Chapter 4, Chapter 5, Chapter 6)
2 (Chapter 10)
3 (Chapter 9)
4 (Chapter 13, Chapter 14, Chapter 17)
5 (Chapter 8)
6 (Chapter 10)
7 (Chapter 20)
8 (Chapter 12)
9 (Chapter 9)
10 (Chapter 12 Figure 12.11)
11 (Chapter 10)
12 (Chapter 10 Figure 10.2)
13 (Chapter 10)
14 (Chapter 10)
a (Chapter 10)
b (Chapter 13)
c (Chapter 21)
d (Chapter 15)
e (Chapter 3)
f (Chapter 8)
g (Chapter 14)
h (Chapter 14)
i (Chapter 17)
15 (Chapter 10)
16 (Chapter 9)
17 (Chapter 12)
18 (Chapter 9)
19 (Chapter 10)
20 (Chapter 12)
21 (Chapter 10)
22 (Chapter 9)
23 (Chapter 9)
j (Chapter 12)
24 (Chapter 8)
25 (Chapter 12)
26 (Chapter 9)
27 (Chapter 12)
28 (Chapter 12)
29 (Chapter 12)
30 (Chapter 12)
31 (Chapter 12)
32 (Chapter 3)
33 (Chapter 8)
34 (Chapter 14)
35 (Chapter 14)
36 (Chapter 12)
37 (Chapter 14)
38 (Chapter 21)
39 (Chapter 14)
40 (Chapter 14)
41 (Chapter 14)
42 (Chapter 14)
k (Chapter 12)
43 (Chapter 8)
44 (Chapter 14)
45 (Chapter 21)
46 (Chapter 17)
47 (Chapter 5)
48 (Chapter 3, Chapter 20)
49 (Chapter 10, Chapter 17)
50 (Chapter 17)
l (Chapter 12)
51 (Chapter 20)
52 (IPCC 2013)
53 Flesch, T.K., R.L. Desjardins and D. Worth. 2011. Fugitive methane emissions from an agriculture biodigester. Biomass and Bioenergy 35(9):3927-3935
54 Nielsen, M. and J.B. Illerup. 2004. Danish emission inventories for stationary combustion plants: Inventories until year 2002. Research Notes from NERI No. 200, National Environmental Research Institute, Ministry of the Environment, Denmark and Environmental Protection Agency (EPA, USA).
55 (Chapter 9)
56 (Chapter 9)
57 (Chapter 9)
58 (Chapter 8)
59 (U.S. Billion-Ton Update: Biomass Supply for a Bioenergy and Bioproducts Industry – 2011 BT2 (U.S. Department of Energy)
60 (Chapter 9)
61 (Chapter 10)
62 (Chapter 10)
63 (Chapter 11)
64 (Chapter 11)
65 (Chapter 10)
66 (Chapter 10)
67 (Chapter 10)
m (Section 2.4.2)
n (Section 2.4.3)
o (Chapter 9)
68 (Chapter 10)
69 (Chapter 11)
70 (Chapter 12)
71 (Chapter 11)
72 (Chapter 12 Figure 12.7)
73 (Chapter 8)
74 (Chapter 12)
75 (Chapter 12)
76 (Chapter 12 Figure 12.21)
77 (Chapter 12 Figure 12.21)
78 reviewed by the IPCC (2013)
79 (Chapter 4)
80 (Chapter 16)
81 (Chapter 18)
82 (Chapter 16)
83 (Chapter 5)
84 (Chapter 10)
p (Chapter 9)
q (Chapter 9)
r (Chapter 9)
s (Chapter 9)
t (Chapter 14)
u (Chapter 10)
85 (Chapter 18)
86 (Chapter 17, Chapter 20)
87 (Chapter 20)
88 (Chapter 20)
89 (Chapter 20 Figure 20.6)
90 (http://newclimateeconomy.report)
91 (Chapter 10, Chapter 20 Figure 20.3)
92 (IPCC 2013)
v (Chapter 9, Chapter 10)
93 (IPCC 2013)
94 (Chapter 12), https://sequestration.mit.edu/tools/projects/decatur.html
95 (Chapter 5, Chapter 11)
96 (Chapter 14)
97 (Chapter 10)
98 (Chapter 14)
99 (Chapter 10)
100 (Chapter 9)
101 (Chapter 18)
102 (Chapter 13)
103 (Chapter 18)
104 (Chapter 10)
105 (Chapter 10)
106 (Chapter 9)
107 (Chapter 16)
108 (Chapter 4)
w (Chapter 18)
x (Chapter 10)
109 (Chapter 12 Box 12.5)
110 (Chapter 12)
111 (Chapter 15)
112 (Chapter 4)
113 (Chapter 21)
114 (Chapter 15)
To cite this book
Souza, G. M., Victoria, R., Joly, C., & Verdade, L. (Eds.). (2015). Bioenergy & Sustainability: Bridging the gaps (Vol. 72, p. 779). Paris: SCOPE. ISBN 978-2-9545557-0-6