
March 2025
ABOUT THIS FACTSHEET
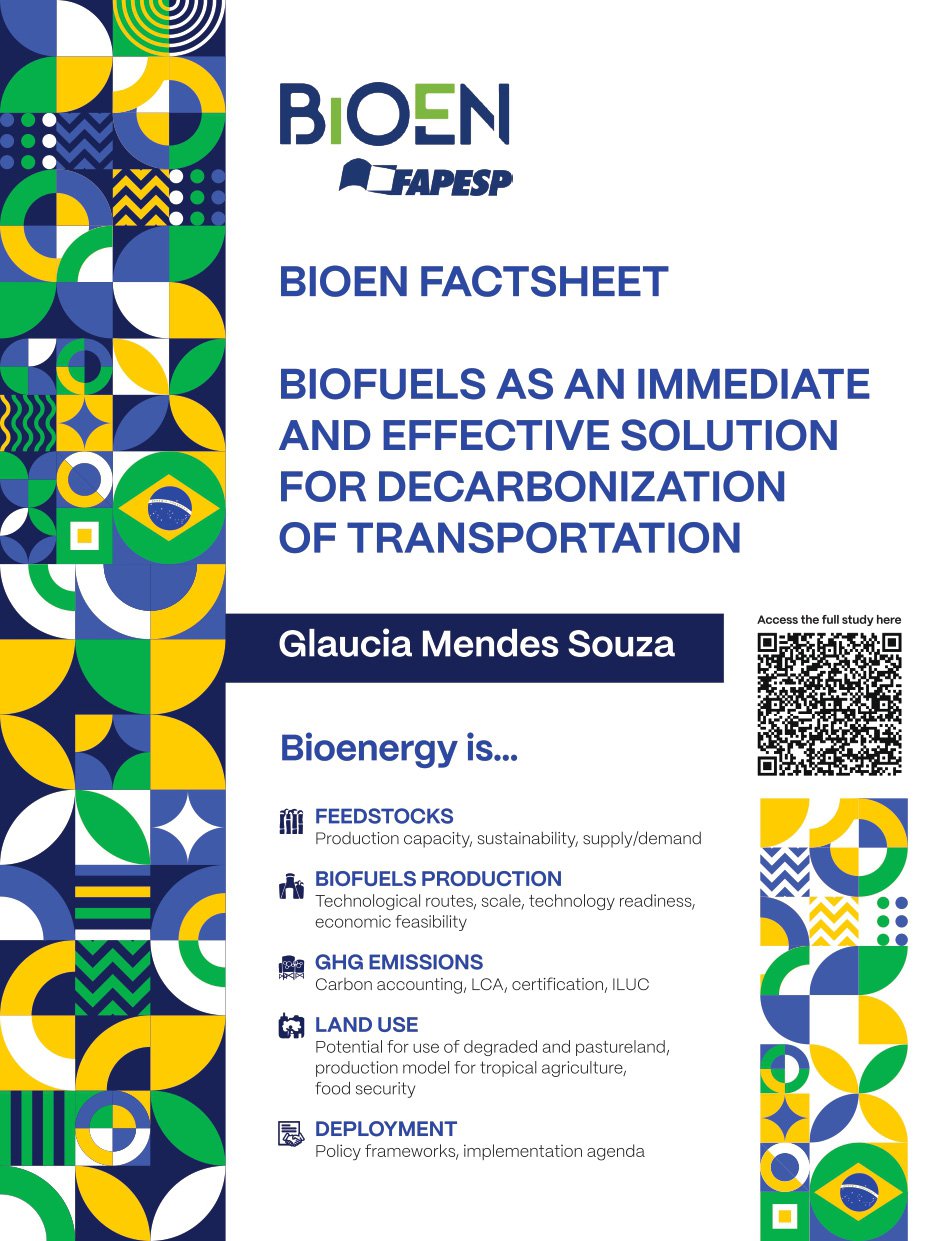
This Factsheet aims to inform and clarify the debate on the potential and sustainability of biofuels. The focus is on biofuels that can be produced in Brazil, sustainably, with sufficient capacity to be relevant for decarbonization of the maritime sector. We found it timely to explain the Brazilian way of land use since tropical agriculture has found a home in Brazil with many developments that could be of interest across the globe.
Brazilian agriculture can be considered top among its peers, and bioenergy is integrated in its industrial infrastructure generating social economic benefits and reducing emissions. This Factsheet refers to work conducted under the aegis of BIOEN, IEA, IEA Bioenergy, IRENA, SCOPE Bioenergy & Sustainability, ANP, EPE, Agroicone, open access peer-reviewed articles and references therein. We expect that by disseminating knowledge through this format we can help a leveled discussion to move forward the climate and sustainable development goals agenda.
- Bioenergy is the “Overlooked giant in renewable resources”. Bioenergy share in the global renewable resources is 50%, as much as hydro, wind and solar combined (Fatih Birol, 2018).1
- The substitution of fossil fuels with biofuels is essential to keep global temperatures from rising. Biofuels use need to grow by 2.5 times from today to 2030, displacing almost 800 Mt of fossil CO₂, or 10% of today’s global transport emissions (IEA Net Zero Emissions scenario).2
- In shipping and aviation, bioenergy, hydrogen and hydrogen-based fuels need to ramp up from less than 1% of energy consumed today to almost 15% in 2030 and 80% by 2050 (IEA NET Zero Emissions scenario).3
- The G20 in 2024 moved forward a set of PRINCIPLES FOR JUST AND INCLUSIVE ENERGY TRANSITIONS with the following recommendation: “We underscore the crucial role of technologically neutral, integrated, and inclusive approaches to develop and deploy a variety of low-emitting energies, sustainable fuels and technologies, including for abatement and removal, carbon management, and emission reduction, with a view to creating scale and global markets to accelerate energy transitions, particularly in hard-to-abate sectors. We encourage, as appropriate, the use of mutually recognized methodologies and standards for assessing greenhouse gas emissions. (FOZ DO IGUAÇU, 04 OCTOBER 2024, G20 Brazil).4
- IEA after a series of consultations and international workshops elaborated a report on the status of policies and methodologies of carbon accounting for biofuels and recommended: “Policies should be technology neutral and feedstock agnostic (International Energy Agency Carbon Accounting for Sustainable Biofuels Report, 2024).5
- Biofuels policy frameworks exhibit a diversity of underlying rules and methodologies for calculating and accounting for GHG emissions (IEA Bioenergy Biofuels Implementation Agenda Report, 2023).6 GHG calculation rules differ among policy frameworks, with national and international legislation sometimes contradicting each other, leading to (international) trade barriers and inefficiencies.7
- On a global level, organizations differ on important definitions and classifications of raw materials8. It is difficult to arrive at an objective, harmonized and internationally accepted classification of raw materials. Policies use different criteria to define advanced fuels. For some, carbon intensity is a defining factor of an advanced biofuel, being called Low Emission Fuels9, while others consider that the use of biomass derived from waste is essential for it to be considered advanced.10
- To fulfill national or regional targets certain feedstocks may be excluded or limited in one country or policy, while being accepted in another. The choice of biomass from residues avoiding the use of food crops reflects fears about Food Security. But it is increasingly clear, however, that the impact of biofuels on food security is not correlated with whether the feedstock is edible or non-edible.11
- The world currently faces a suite of urgent challenges: environmental degradation, diminished biodiversity, climate change and persistent poverty and associated injustices. All of these challenges can be addressed to a large extent through agriculture. A dichotomy expressed as ‘food versus fuel’ has misled thinking and hindered needed action towards building agricultural systems in ways that are regenerative, biodiverse, climate resilient, equitable and economically sustainable. Scientists call for refocused conversation and united action towards rapidly deploying such systems across biophysical and socioeconomic settings and a reconciling of the food security and bioenergy narrative.12
- This Facsheet aims to inform and clarify the debate on the potential and sustainability of biofuels. The focus is on biofuels that can be produced in Brazil, sustainably, with sufficient capacity to be relevant for decarbonization of the maritime sector. We found it timely to explain the Brazilian way of land use since tropical agriculture has found a home in Brazil with many developments that could be of interest across the globe. Brazilian agriculture can be considered top among its peers, and bioenergy is integrated in its industrial infrastructure, generating social economic benefits and reducing emissions.
- This Facsheet refers to work conducted under the aegis of FAPESP BIOEN, IEA, IEA Bioenergy, IRENA, SCOPE Bioenergy & Sustainability, GBEP, EPE, ANP, Agroicone, open access peer-reviewed articles and references therein.
- We expect that by disseminating knowledge through this format we can help a leveled discussion to move forward the Climate and Sustainable Sevelopment Goals (SDGs) agenda.
- Bioenergy is biomass that can be converted to biofuels and stored for many different applications (solid, liquid and gas). Biofuels production and use can contribute to energy security, food security, environmental and climate security, and several of the sustainable development goals while reducing GHG emissions. When associated to carbon capture and sequestration it can lead to negative emissions.13
- Biofuel sourcing and production are in many cases mature, making them readily available for immediate use as blends or direct replacement fuels, with minimal to no need for adjustments in operations or infrastructure14, as opposed to the use of ammonia or methanol as fuel in shipping, for instance, since maritime vessels require engine modifications and fuel supply system development for the latter.15
- Liquid biofuels production must expand 150% to reach the levels required for carbon neutrality in transportation by 2030 in the IEA Net Zero Emissions scenario.16
- To achieve NET Zero Emissions IEA calculates bioenergy, hydrogen and hydrogen-based fuels need to ramp up from less than 1% of energy consumed today in shipping and aviation to almost 15% in 2030 and 80% by 2050. In this scenario biofuels share in shipping final energy consumption is expected to grow from 0% in 2022, to 8% in 2030, to 13% in 2035 and 19% in 2050 with biofuels being the most relevant until 2035.17
- IEA data show that global demand for biofuels is expected to exceed 215 billion liters in 2030, compared to approximately 180 billion liters in 2024.18
- Most of the growth in modern bioenergy use in the NZE Scenario comes from the emerging market and developing economies, where it almost doubles by 2030.
Scale
- Conventional Biofuels such as ethanol (sugarcane, corn) and biodiesel (soybean, palm) are being sustainably produced and commercialized in substantial quantities in several countries. They represent, so far, the most relevant biofuels to replace fossil fuels in the world.19
- Of the Advanced Biofuel options under development, hydrotreated vegetable oil (HVO) is the only biofuel that has reached commercial scales.20
- Biofuels produced exclusively from crop residues and non-food crops seem not to be economically produced on a scale large enough to replace the current volume of conventional biofuels in the middle term.
Technological Routes
- Conventional biofuels have food crops as their main feedstock and are produced in integrated food-energy systems which can bring advantages for the agricultural production system. Food, feed, fuel and power are produced in parallel.21
- Biodiesel is produced by transesterification of vegetable oils, extracted from oil seeds, hydrogenation not being necessary.
- The main product obtained from soybeans is protein, which is used in the food and feed industry, vegetable oil, biodiesel being a by-product.
- Ethanol is produced by fermenting sugars.
- In addition to ethanol, the mills that use sugarcane produce sugars, molasses, yeast, spirits, feed, cellulose, and those that produce corn produce oil and DDG, a highly nutritious animal feed used for cattle, pigs, poultry and pets.
- The technologies used for advanced biofuel production are fermentation to cellulosic ethanol, hydrotreatment of oils and fatty acids, transestetification of vegetable oils, gasification followed by FT-synthesis and fast pyrolysis.
Marine Biofuel Tests
- Companies have already used the B100 as a substitute for fossil diesel in Brazilian inland vessels.
- The Brazilian ethanol sector and Wartsila are cooperating in a research program to test ethanol as a fuel option for ships powered by methanol dual-fuel engines. Ethanol tests were run on a Wärtsilä 32 multi-fuel platform engine during mid-February 2024.22
- Preliminary studies indicate that replacing fossil fuels with sustainable ethanol can reduce CO₂ emissions by up to 80% on routes from Brazil to Europe.23
- Sugarcane is the main raw material for ethanol production in Brazil, followed by second-crop corn ethanol, produced in a succession system with soybeans.
- Soybean oil is the most important feedstock source for biodiesel production in Brazil (around 75% in 2024).24
- Beef tallow, palm oil and various other inputs in 2023 contributed with 15% of the biodiesel produced in Brazil the remaining including several other sources.25
- For the coming years, corn ethanol production is expected to reach 8.3 billion liters in 2024/25, and may reach 17.5 billion liters in 2034, that is, an increase of 110% in the period.
- Low quality wheat and triticale grains, when inappropriate for the food industry, show also potential to be used for ethanol production.
- For SAF Brazil has projects announced or in planning using soy, beef tallow, palm, macauba and sugarcane as feedstocks.
- For Sustainable Marine Fuels (SMF), Petrobras conducted the first test of bunker fueling with renewable content in the country (a blend of 90% conventional or mineral marine fuel oil (bunker) and 10% biodiesel). The tests were expanded to a mixture of 76% bunker and 24% biodiesel. The biodiesel used in the test was produced from a mix of 30% beef tallow and the remainder from soybean oil.
Ethanol in Brazil
- Brazil has now 359 sugarcane ethanol production plants.26
- In the accumulated of the 2024 agricultural cycle, the manufacture of bioethanol totaled 37 billion liters (+3.07%), with 24,2 billion of hydrated ethanol (+12.6%) and 12,8 billion of anhydrous (-8.6%).27
- Brazil has 24 corn ethanol plants in operation at the moment using 11% of the corn produced in the country.28
- Brazil produced 6.3 billion liters of corn etanol in the 2023/24 harvest and is expected to reach more than 8.25 billion liters in this cycle (2024/25), with a forecast of 16.6 billion liters in 2023/34.29
Biodiesel in Brazil
- Brazil has 58 biodiesel production plants30.
- The 2023/24 cycle yielded 147.7 Mt of soybeans, the second highest in history. Biodiesel production increased by 27% to 10 billion liters, with soy as the main raw material (74% share).31
Ethanol and biodiesel in emerging markets
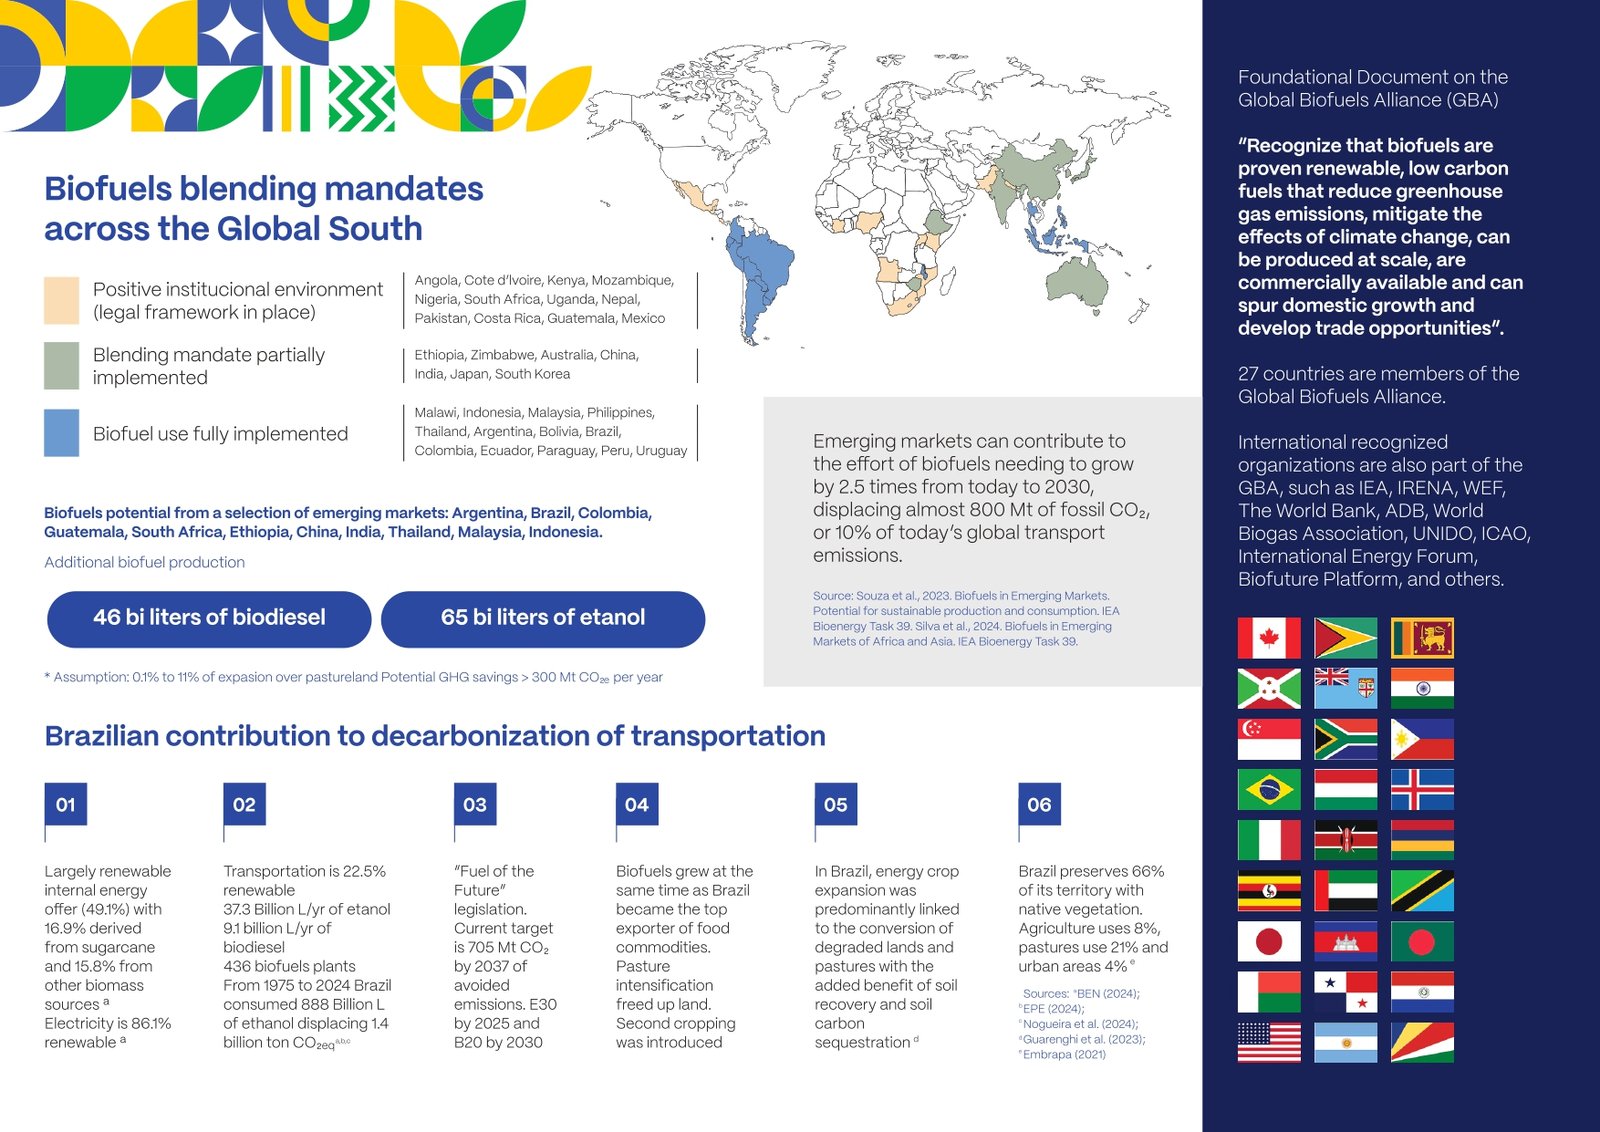
- Using a harmonized life cycle assessment and a techno-economic analysis, a production potential of 45.7 billion liters of biodiesel and 64.7 billion liters of ethanol was estimated in eleven countries in Latin America, Africa and Asia using technologies that already exist and with cultures already established in their territories.32,33
Productivity and efficiency gains
- The sugarcane sector has become increasingly more efficient, since the cultivated area has grown at a lower rate (+1.5 times since 1985) than the stalk production (+1.8 times), and especially at a much lower rate than the production of derived products, such as sugar, ethanol, and bioelectricity (+5.0 times), thanks not only to improved crop yield and juice quality, but also to substantial increases in industrial efficiency in the last decades34.
- Gains in productivity were also observed for food crops in Brazil. From 1977 to 2014 while soybean production grew 740%, its planted area grew 272%. Corn production grew 478% and the planted area grew 39%. This shows an important gain in productivity (especially resulting from double cropping), and implies that a significant amount of land was saved as a result of productivity gains35.
- In Brazil, the production of second-crop corn ethanol occupies only 0.5% of the area designated for agriculture and less than 0.15% of the national territory.36 Brazil is among the largest corn exporters in the world, alternating the lead with the United States. The amount of corn processed for ethanol production has increased by 136% in the last four years, and represents only 15% of corn consumption at the national level.
- Although productivity gains have been relatively stable in recent harvests, the three main energy crops (soybean, corn and sugarcane) have not yet reached their theoretical productivity limits, close to those found in experiments with controlled production factors. They imply control and intervention with cultivars suitable for different types of soil and climate, resistant to pests and diseases, efficient machinery, appropriate management for each crop, and breeding, among others37,38. And in the case of corn, the short-term increase is possible, without the need to expand new productive areas.
Biofuels supply and demand effects on food security
- Supply and demand of biofuels are affected by different policies in the world such as the California Low Carbon Fuel Standard (LCFS), the US Inflation Reduction Act (IRA), the EU Renewable Energy Directive (RED) and the Brazilian Renovabio39.
- The impact of biofuel policies (mandates, tax credits, import and export tariffs) on food prices has been extensively analysed40 (Argentina, Brazil, India, Indonesia, EU and US) revealing very limited impacts on agricultural commodities although price variation for biofuels will be affected.
- The introduction of corn ethanol production in the Center-West region of Brazil had a significant impact on domestic market demand; however, it did not substantially affect the domestic prices. A stable long-term relationship between international prices and corn prices in Brazil. Fluctuations in international prices can predict changes in Brazilian domestic prices. The reverse was not statistically confirmed. The rise in corn prices in Brazil cannot be attributed to the increased demand from local mills.41
- The increase in demand for corn for ethanol production in Brazil has not reduced the supply of corn for food and feed in the domestic and international markets. The price in the domestic market of animal feed and proteins for this consumption base fell in 2024.42
Food production alongside environmental preservation and biofuels production
- Brazil is the world’s largest producer of soybeans, coffee, orange juice and sugar, the second largest producer of chicken meat and beef and the world’s largest exporter of these six products, besides corn and pulp.
- Some of the commodities exported, such as soybeans and corn, are the basis for the production of animal products, such as meat, milk, eggs, in several countries.
- This great advance in agricultural exploration took place in a context, often ignored by the world, that Brazil is one of the countries that most preserves the environment.
- Brazil has an area of 850 million hectares and preserves approximately 66% of its territory with forests43,44. Integral conservation units and indigenous lands occupy 200 million hectares (23% of the territory). About 49% of rural properties are occupied with native vegetation, making up 33% of the Brazilian territory.
- Brazilian rural producers must maintain at least 20% of their own area with preserved or recovering native vegetation. This percentage of preservation is increased due to a minimum range of conservation on river banks and hilltops, and can also be expanded within priority areas for conservation. In the vicinity of the Amazon, the minimum preservation is 80%.
Soil protection alongside biofuels production
- Sugarcane production is alternated with cultivation of peanuts and soybeans in the areas of sugarcane field reform, decreasing the use of fertilizers, increasing local biodiversity and promoting income in the same productive area, in a sustainable way.
- In the case of soybeans, the planting is alternated with maize to generate ethanol and co-products, thus allowing for combined food, feed and energy production45, saving nitrogeous fertilizers.
- This dual planting system takes advantage of the capacity for nitrogen fixation that legume species (such as soy and peanuts) have which brings nitrogen to soils reducing the need for fertilization.
- The production in mills of biofuels also contributes to soil protection since organic matter left over from biomass and biofuels processing can be recycled back to the fields.46
Agriculture modernization alongside biofuels production
- It has been observed that increased revenue in rural areas due to biofuels production led to innovation in the brazilian agribusiness, agriculture modernization, the development of best management practices, improving yields and sustainability.
- Best management practices associated to biofuels production that improve productivity, preserve soils and prevent land degradation include47: use of green manure, planting in beds, GPS techniques, straw layer in the soil, soil correctives (limestone, gypsum, oxides or remineralizers for remediation of soil restrictions, applied by haul or in beds and rows, allows roots to develop deep in the soil, exploring more water and nutrients), development of new varieties of sugarcane, use of bioinputs, vinasse use in fertigation, forest preservation, principles and execution of agroecological zoning48.
- It is estimated that the production of biofuels in Brazil (ethanol and biodiesel) could increase by up to 4 times only with these “land-saving” techniques, that do not cause expansion of new agricultural areas, such as recovery of degraded areas, use of agricultural residues, increased productivity and sequential crops (e.g., second crop corn).132
Carbon capture alongside energy production
- The land cultivated with sugarcane in Brazil removed 9.8 MtCO2/year from the atmosphere, which over 20 years represents a total removal of 196 MtCO2 (equivalent to planting 1.4 billion trees, occupying an area larger than 1 million football fields or 80 times the city of Paris covered in forest).
- Increases in land carbon stocks were possible mainly due to the expansion of sugarcane over degraded pastures and other agricultural land uses, the transition from conventional burned harvesting to unburned sugarcane harvesting, and a reduced expansion over native vegetation49.
- Over the last two decades, approximately 98% of sugarcane expansion has occurred over areas already in agricultural use, mainly over degraded pastures, and less than 1.6% of the entire area currently occupied by sugarcane was occupied by natural vegetation in 2000.50,51.
Social-economic development alongside biofuels production
- Biofuels have a proven track record in improving socio-economic indicators52,53,54,55. Improved indicators include literacy, schooling years, wages, number of jobs, types of work contract, working conditions, improved outlook for the daughters and sons of workers. When formal work is compared in agriculture (excluding sugarcane) and the sugarcane sector, 86.98% of the work force was found to be formally employed in sugarcane in comparison to 34.23% in agriculture56. The average wage was found to be 46% higher in the sugarcane sector when compared to other agricultures. A new mill increased the municipalities GDP per capta in US$ 1,098 (first year) and US$ 1,029/yr (for 10 years)57.
- In 2023 the sugarcane sector had 2.2 million direct and indirect jobs and 737,774 direct jobs58 with the involvement of more than 70,000 small producers.
- Incentive programs for small rural producers in the production of biofuels have a significant impact on family income. The PNPB (National Program for the Production and Use of Biofuels), launched in 2004 in Brazil, provided an increase in the annual family income of small producers in the order of 4 times (from R$ 18 thousand to R$ 80 thousand/year).
- Many countries that produce biofuels from corn, sugarcane, soy or palm also produce bioelectricity in the mills which is exported to the grid. This is quite significant, in Brazil where cane bioelectricity can power 10.8 million homes. This increases energy access in rural regions. Energy use has a direct correlation to Human Development Index.59
Land use in the world
- The global land area corresponds to about 13 billion hectares (ha).
- In 202260, the world’s total agricultural land was 4.7 billion hectares (1.5 billion hectares used for agricultural land and 3.2 billion hectares for meadows and parturas.
- The rest of the global land area is divided into forested land (4.0 billion ha) and other land (4.5 billion ha of deserts, glaciers, drylands, built-up areas, etc.).
- In the two decades since 2001, the world’s total area of agricultural land has grown by 80 million hectares – about 5% – while pastures have decreased by 170 million hectares, a decrease of 6%.
- From 2001 to 2022, the total area of agricultural land per person decreased by 20%, from 0.24 to 0.20 hectares per capita.
- From 2001 to 2022, land productivity, measured in terms of the total gross value of agricultural production, grew by nearly 60%, from $546 per hectare to $872 per hectare.
Land for food production
- Globally there are up to 1,4 Bha of suitable land available for sustainable rainfed agriculture without taking forests and urban uses into account.61
- This is more than enough to expand the present agricultural area to fulfill growing demands for food production, which is calculated to need an additional 130-219 Mha after taking lower yield increases and possible negative effects of climate change into account.
Land for bioenergy production expansion
- The areas of degraded and deforested land worldwide are huge with the available estimates ranging from 1 to 2 billion hectares depending on the source of information. Bioenergy crops can be deployed to improve up to 600 Mha of degraded land and make it productive again.62
- There is sufficient marginal and degraded land available for cultivating bioenergy crops in developing countries.63
- Estimates on conversion of pastureland into bioenergy cropland in Argentina, Brazil, China, Colombia, Ethiopia, Guatemala, India, Indonesia, Malaysia, South Africa, and Thailand indicate great potential for reductions in GHG emissions and implementation of biofuel blending mandates.64,65
- The opportunities for expansion to areas of degraded pastures and low productivity are enormous in Brazil. If only degraded pastures are considered, Brazil has between 28 and 36 million hectares suitable for agricultural conversion66,67. It is estimated that the total area of degraded pastures can reach 90 million hectares, if other definitions such as unused land are included, and part of this area is suitable for agricultural production.
- There is a significant amount of land available for agricultural expansion, and the trend of intensification of cattle ranching suggests that the growth in ethanol production is unlikely to adversely affect food production in Brazil, despite the large expansions planned.68
- The favorable climate in the Center-West region of the country allows corn cultivation to be done right after soybean cultivation. Brazil has the potential to expand the cultivation of second crop corn considering underutilized soybean areas, degraded pastures and increased crop productivity.69
GHG savings when pastureland is converted into energy crop land
- Potential GHG savings > 300 Mt CO2e per year could be achieved in Argentina, Brazil, China, Colombia, Ethiopia, Guatemala, India, Indonesia, Malaysia, South Africa, and Thailand by producing biofuels and adopting biofuel blending. 70,71,72
- Using a harmonized life cycle assessment and techno-economic analysis the required land in these eleven countries to achieve these savings was found to be from 0.1% to 10.7% of their pastureland (55% from doubling ethanol in Brazil).73,74,75
- The effects of sugarcane expansion over pasture areas on soil carbon stocks are dependent on the productive capacity and/or degree of pasture degradation with a payback time of 2-3 years for soil carbon recomposition.76
- Together, the potential ethanol production in SSA and LAC (including Brazil), 60Mm3 year, would correspond to 85.7 Mton of CO2 mitigated annually. This is equivalent to the C stored in 110 thousand hectares of the Amazon forest (standing trees, dead wood, litter, and soil organic C at the 0–30 cm layer).77
- The global food versus fuel debate is dominated by misinformation78, causing policy makers to hesitate implementing policies to stimulate bioenergy production when it could benefit food security79,80. There are synergistic and positive relationships between food production and bioenergy systems.81,82,83,84,85,86,87,88,89
- FAO, GBEP, IRENA, IEA, IRENA, UNECE, among others, issued a joint statement on bioenergy recognizing that “Through good governance, sustainable bioenergy addresses the risks related to the land and resources used for its production and the potential impacts on food security, natural ecosystems and carbon stocks, as well as the challenges in managing equity and justice, and achieving economic competitiveness and affordability.”90
- Biofuels are not the only driver for price variation in food commodities. Other variables such as fertilizer prices, energy prices, transport costs, government policies are directly affected by macroeconomic uncertainties and may have a larger impact on price variability in agricultural markets than biofuel policies.
- The use of double cropping systems demonstrate that food and bioenergy production can occur in an integrated and efficient way, increasing land use efficiency, providing co-benefits such as improved biodiversity and soil carbon sequestration.91,92,93
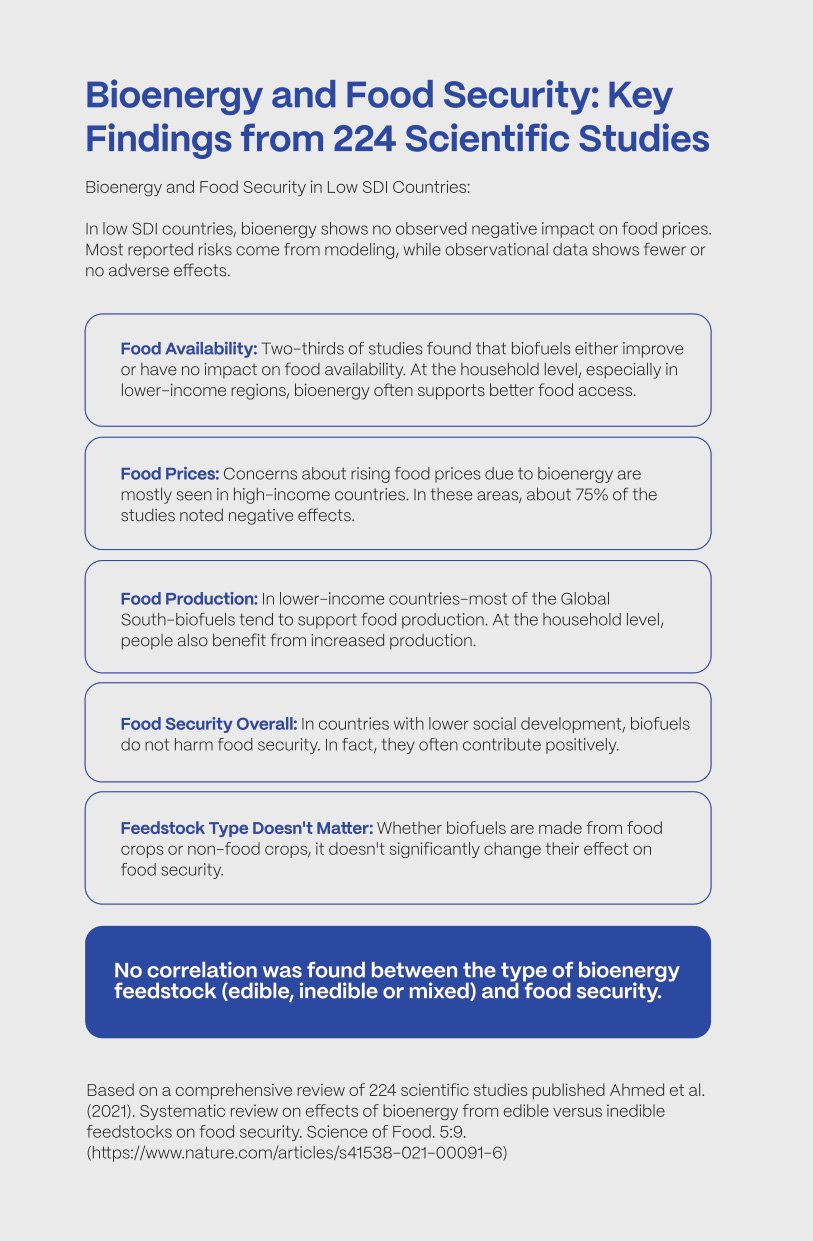
- A Systematic Review94 on Effects of Bioenergy from Edible versus Non-Edible Feedstocks that examined 224 studies on bioenergy’s impacts on food security verified the effects of various classes of bioenergy feedstocks on food security parameters (food availability, food prices, and food production):
- There is little evidence of a relationship between the type of bioenergy feedstock (edible, inedible, or both edible and inedible) and food security.
- For food availability, approximately two-thirds of the articles reported positive effects or no effects and one-third reported negative effects.
- For the food price, over threequarters of the publications reported a negative effect of bioenergy production on food price and the negative effects were concentrated on countries with High Social Development Index (SDI).
- Papers that examined food prices that included low SDI countries, or that examined the household or regional scale found no effect of bioenergy on food security.
- For the food security parameter of food availability the analysis revealed positive effects of bioenergy.
- Considering spatial scales (household, community, regional, national, multinational, global, and multiple spatial scales) the reported negative effects were evenly distributed, with the exception of the household scale, where positive effects were most prevalently reported (57%).
- Studies that report negative effects are most commonly based on modeling. When observed data was used the reporting of negative impacts was lower.
- Regarding the food security parameter of food production, papers that included low SDI countries or examined food security at the household scale were more likely to report positive effects of bioenergy on overall food security.
LCA
- There is general agreement that bioethanol from sugarcane and corn, and biodiesel from soybeans and palm can all present significant reductions of emissions when compared to fossil fuels95,96,97 reducing up to 84% of emissions.
- Significant reductions of emissions have also been found when analysing brazilian biofuels for maritime applications.98,99
- In Brazil, a net carbon removal of 9.8 TgCO2∙yr−1 was calculate for sugarcane cultivation areas in the 2000–2020 period, which was due to the expansion of sugarcane over poor quality pastures (55% of the gross removals), croplands (15%) and mosaic (14%) areas, and the transition from the conventional burned harvesting to unburned (16%). Moreover, 98.4% of expansion was over existing agricultural areas. Considering all the land use changes within sugarcane-producing rural properties, the net removal is even larger, of 17 TgCO2∙yr−1, which is due to vegetation recovery.100
- The potential for mitigating bioethanol emissions can be even greater, reaching emissions close to zero or even negative. Technological advances, the adoption of better agricultural practices and the consequent increase in biomass production, in addition to the greater use of waste such as straw for the production of 2G bioethanol, and the use of biomethane produced from by-products of sugarcane processing, replacing diesel used in agricultural machinery, will play an important role in mitigating GHG emissions for 1G and 2G bioethanol.
- Implementation of Bioenergy with Carbon Capture and Storage (BECCS) technology, which captures and stores CO2 during the bioethanol production process, can also enable a negative carbon footprint for Brazilian bioethanol, contributing to further mitigate GHG emissions to values close to 30 gCO2e/MJ101,102. With the recent Bill for the Fuel of the Future Program, Brazil intends to advance in the regulation of carbon capture and storage.
- The carbon footprint of second-crop corn ethanol is among the lowest, being similar to sugarcane ethanol and lower than American ethanol. Second-crop corn and the use of biogenic biomass for heat generation in processes are the main factors contributing to the low GHG emission of second-crop corn ethanol.
- Although core lifecycle assessment of biofuels is well understood, the available literature shows a wide range of GHG emission results across different biofuel value chains.103
- Carbon accounting methods vary under different policy frameworks. For instance, CA LCFS uses CA-GREET, EU REDII/REDIII uses default values for multiple pathways and methodology for individual calculations in RED II, Annex V, RenovaBio uses RenovaCalc, and ICAO uses GREET as the models for calculating default and individual core values.
- A comparison of GHG emissions of several biofuels show a large range of values in comparison to the default values of EU RED II.104
- Once harmonized with standardized assumptions, all the models give quite comparable results.105
ILUC
- ILUC calculations are based on unobservable and unverifiable parameters and are dependent on assumed policy, economic contexts, and exogenous inputs.106
- ILUC effects, although formerly very controversial are now seen to have far less impact than previously thought and based on economic models that are not adequate for land use modelling.107
- ILUC numbers cannot be used to negate the effectiveness of biofuels to decarbonize transportation.108
- The expansion of sugarcane and secondary-crop corn presents low risks of deforestation, related to direct change (dLUC) and low risks of indirect change (iLUC).109,110
- There is consensus that the carbon intensity of ethanol from sugarcane, corn and wheat ranges from 19-50 gCO2e/MJ without ILUC. For corn ethanol from Brazil, the carbon intensity can be close to zero or negative. Typical fossil fuel ranges are 87 to 100 gCO2/MJ. Under the EU framework when ILUC is considered, the range for crop-based biofuels becomes an impressive 60-120 gCO2/MJ. There is a clear trend to classify biofuels, according to the EU classification, as an emitter similar to a fossil fuel.
- The expansion of sugarcane and second-crop corn in Brazil has protected areas of natural vegetation111,112. Models that estimate iLUC for second-crop corn bioethanol, in fact, indicate values close to zero and negative113,114. For sugarcane, the estimated iLUC values are lower than those of other biofuels based on different raw materials.
- The expansion of second-crop corn ethanol poses a low-ILUC risk because it does not require the conversion of additional land for its cultivation. This approach makes more efficient use of existing agricultural areas, avoiding the need for deforestation or reuse of natural habitats. In addition, there are already certified cases under the CORSIA framework that demonstrate low risk of LUC, highlighting the viability and sustainability of second-crop corn ethanol within global decarbonization strategies.
- A number of recommendations were made for the G20 to avoid inconsistencies, in particular in regards to ILUC:115
- GHG and carbon accounting rely on Lifecycle Assessment (LCA). Input data and methodology for LCAs must be transparent, evidence-based, and verifiable.
- For LCA or other technical-economic assessment results to be comparable, consistent system boundaries must be applied.
- International standards exist for quantifying the net greenhouse gas (GHG) emissions footprint of biofuels, and for assessing biofuel sustainability. Such standards recommend the use of “best available data,” emphasizing that data must be representative of the system being assessed.
- LCA methods are recognized as being robust with the notable exception of potential or induced effects such as indirect land-use change (ILUC). International collaborations are constantly improving the transparency and consistency of LCA methods including those associated with allocation, carbon removals, and carbon credits.
- Quantitative ILUC values cannot be directly measured or scientifically verified.
- Quantitative ILUC factors shall be avoided in GHG accounting as they have not been proven to provide consistent results across models or to support effective actions for reducing LUC emissions.
- Action is urgently needed to unlock innovation, investment and sustainable bioenergy production using robust, credible and effective mechanisms.
- Performance-based mechanisms should rely on verifiable metrics that are technology-neutral and feedstock-agnostic.
- The G20 must show leadership by promoting consistent political guidance for GHG accounting and to identify and share alternatives such as the ILUC risk-based approach, or direct measurements, that are more effective and broadly applicable for global implementation.
- Biofuel sustainability has been evaluated in many settings from local to regional to country-wide approaches and consolidated through the implementation of voluntary or mandatory schemes. The GBEP Sustainability Indicators for Bioenergy116 (GSIs) are a set of 24 relevant, practical, science-based, voluntary sustainability indicators that address all forms of bioenergy. They provide policymakers and other stakeholders with a tool to measure and monitor the sustainability of all types of bioenergy pathways, as compared with the business-as-usual scenario (e.g. traditional bioenergy or fossil fuels). The results of GSIs offer valuable insights for shaping national bioenergy policies and programs while helping to identify and address potential environmental, social, and economic risks and obstacles. The indicators have been implemented in 15 countries.
- Biofuels policy frameworks117 exhibit a diversity of underlying rules and methodologies for calculating and accounting for GHG emissions and differ in the degree of stringency and robustness. Policies use verification/certification for the implementation of these rules118. In this work conducted by IEA Bioenergy for SAF, it was noted that:
- Differences in data quality and transparency of supply chain data reduce visibility and traceability of GHG emissions and complicate data verification.
- Differences in GHG targets and calculation methodologies increase complexity for the exchange of SAF between policy frameworks.
- Labelling and classification of feedstock materials diverge in policies and could pose a risk since feedstock categorization is linked to GHG performance.
- Different implementation of policies into verification/certification usage and requirements hinders mutual exchange.
- Requirements for auditor competence vary, which can impact the quality of the auditing on certification/verification.
- Potential misuse and double counting could occur with trade.
- The policy differences create a challenge for international supply chains as feedstocks and biofuel batches need to fulfill all the sustainability requirements set out in any policy where they may be used. Flexibility between policy frameworks isn’t possible and double certification is costly.
- The policy differences, lack of transparency and traceability between countries, different certification/verification schemes and registries might create a risk regarding double counting of GHG savings. This could lead to higher reported total GHG savings than actually achieved in practice.
- An opportunity to increase the robustness of policy frameworks is to ensure a level playing field and harmonized implementation rules to the greatest extent possible. Cover hard to harmonize discrepancies between frameworks in the short term by means of mutual agreements. For the long term, by means of complementary (regional) regulations.
- Several policy frameworks allow for multiple schemes to be used for proofing compliance such as the International Sustainability and Carbon Certification (ISCC) and Roundtable on Sustainable Biomaterials (RSB) with RSB being more aligned with Renovabio standards and local agricultural practices.
- Leaders in biofuel production, such as Brazil, have demonstrated their capacity for sustainable production through robust and internationally recognized certifications, such as ISCC and RSB.
- A comparison of verification protocols of four sustainability standards and certifications has been done for the Roundtable on Sustainable Biomaterials (RSB), Sustainable Forestry Initiative (SFI), Forest Stewardship Council (FSC), and International Sustainability and Carbon Certification (ISCC). All of them prioritize the conservation of high biodiversity land, protect soil, water, and air quality, and promote climate change mitigation efforts. Additionally, they require responsible management practices for feedstocks or forests that avoid causing any harmful environmental impacts. Moreover, they aim to support rural and social development, while respecting the rights of Indigenous Peoples.119
- Coordination and exchange of information is necessary within and among (policy) frameworks and auditors to prevent doubling of claims in cases where this is not permitted. An example is the ISCC-format for auditing, that requires information on other sustainability audits done at the same location.
- Sugarcane also has the Bonsucro International Certification System (based in London) with specific requirements for sugarcane. With annual audits by independent members, Bonsucro Certification covers aspects of social and environmental impact and more sustainable production of sugarcane. Because it does not certify deforestation areas (and other requirements), Bonsucro is an important tool in the sector as a mechanism to ensure low LUC for deforestation. Bonsucro is a consolidated global certification that covers production in 54 countries (including Brazil, Central America, India, Australia, among others).120
Renovabio
- Renovabio is a modern legislation that is part of Brazil’s strategy to achieve the commitments to the Paris Agreement on Climate Change and is in accordance with the Declaration of Vision issued at COP-23 (Bonn, Germany) in 2017.121
- Producers that register at Renovabio will be rewarded for proven reduction of GHG emissions of their biofuels when replacing fossil fuels, through independent certification agencies, based on the cradle-to-wheel life cycle analysis.
- Decarbonization certificates, or CBios, are issued by financial institutions depending on the individual biofuel producer’s performance in volume and efficiency. One CBio is equivalent to 1 ton CO2eq of avoided emission.
- Since June 2020, CBios are negotiated at the Brazilian Stock Exchange, in amounts linked to the decarbonization goals of Brazil, established by the government for a 10-year period. Such goals for 2019–2029 were published in a government resolution, which established the transport sector’s annual decarbonization targets, including subtargets for fuel distributors, to be compensated with CBios.
- Bioenergy producers must comply with specific regulations to be eligible for the RenovaBio Program. The Program includes (a) a ban on the direct suppression of natural vegetation, applicable across all Brazilian biomes, along with (b) compliance with the Forest Code, which includes tools for transparency such as the Rural Environmental Registry (CAR); (c) the requirement for traceability of raw materials; (d) compliance with the Agroecological Zoning of Oil Palm (ZAE-Palma), which aims to limit the expansion of oil palm cultivation in sensitive areas and over native vegetation.
- The combined legislations of Renovabio and Forest code are reaching its objectives of estimulating biofuels production while preserving the environment using a risk-based approach to deal with ILUC122. LUC emissions changes in a scenario of Renovabio with and without the conversion-free criteria (“Renovabio + Forest Code” vs “Renovabio – Forest Code”) was evaluated showing effectiveness in its approach to limit ILUC in the Renovabio Program. Significantly lower emissions (-428 Mt CO2e) with the no-conversion criteria compared to the no-criteria alternative were estimated, representing an additional reduction in 63% of emissions with the no-conversion elegibility criteria.
Comparative analyses between RenovaBio and other policies
- On a global level, organizations differ on important definitions and classifications of raw materials123. It is difficult to arrive at an objective, harmonized and internationally accepted classification of raw materials. Policies use different criteria to define advanced fuels. For some, carbon intensity is a defining factor of an advanced biofuel, being called Low Emission Fuels124, while others consider that the use of biomass derived from waste is essential for it to be considered advanced.125
- The choice of biomass from residues avoiding the use of food crops reflects fears about Food Security. But it is increasingly clear, however, that the impact of biofuels on food security is not correlated with whether the feedstock is edible or non-edible126.
- This is currently a matter of discussion in the EU where Member States give a different meaning to the definition of REDII Annex IX A(d) ‘biomass fraction of industrial waste not fit for use in the food or feed chain’. Another example of divergence between policies is the promotion of ‘advanced biofuels’ based on feedstocks listed on Annex IX A of EU-RED, while this definition is completely non-existent in Brazil’s RenovaBio.127
- GHG calculation rules differ among policy frameworks, with national and international legislation sometimes contradicting each other, leading to (international) trade barriers and inefficiencies.
- An important example is how iLUC is treated. In systems where iLUC is part of the carbon intensity calculation (US – LCFS and RFS, CORSIA), this can give these countries a disadvantage compared to systems that do not include iLUC in the carbon footprint (Brazil – RenovaBio, EU – RED III), especially for raw materials with high iLUC, such as palm oil. Contradictory rules do not allow for the comparison of GHG values across policy frameworks. For example, frameworks differ in how improvements in farm or process management are rewarded in the GHG calculation. EU-RED allows the use of fixed emission reduction values in the case where manure is used as feedstock or when crops are grown on degraded land, while ICAO CORSIA allows the use of fixed emission reduction values in the case of avoided emissions related to landfills or recycling.128
- To fulfill national or regional targets certain feedstocks may be excluded or limited in one country or policy, while being accepted in another. For example, in Europe, crop-based fuels are excluded (ReFuelEU Aviation) or less incentivized (EU-RED). At the same time, multipliers are used to further stimulate the use of specific feedstocks to meet SAF targets and for the deployment of SAF in general (EU-RED). Another example is feedstocks with a high risk of ILUC like palm oil. These types of feedstocks, unless certified as low-ILUC risk feedstocks, are for instance phased out in European policies but accepted in other policies.129
- Diverging definitions and classifications brings difficulties to mutual recognition and comparability. It could lead to preferred feedstocks or fuels under certain policy frameworks. Feedstocks will likely flow to countries with the least strict sustainability and auditing requirements, impacting the trade flow and effectiveness of policy frameworks worldwide. For example, the US and Brazil mainly focus on SAF production based on dedicated crops for biofuel production. Generally, local waste streams are less under consideration. In the EU, local waste streams are considered to be preferred feedstocks and stimulated. At the same time, European policies have stricter requirements on crop based feedstocks competing with the food industry. These discrepancies could potentially lead to trade flows of waste streams to the EU and trade flows of food and feed crops to the US and Brazil.130
- Sugarcane Production: In 2024, 690 million tons of sugarcane were processed, the second best in history (after 2023). Sugar production was 44.3 million tons.
- Ethanol Production: Total ethanol production was 37.3 billion liters, higher than the all-time high in 2019, with 29.7 billion liters from sugarcane and 7.7 billion liters from corn (an increase of 32%). Net ethanol exports were 1.7 billion liters.
- Bioelectricity: In 2023, bagasse continues to be the most used fuel for energy exports to the National Interconnected System (SIN), accounting for 74.5% (an increase of 2.5%). Sugarcane plants injected 2.4 GW on average into the SIN, 14% more than in 2022.
- Fuel Prices and Consumption: The price ratio between hydrous ethanol and gasoline C remained favorable to the biofuel throughout 2024, at an average of 65%. The prices of hydrous ethanol and type C gasoline decreased 20% and 10%, respectively. The demand for hydrous ethanol grew 30%, and the consumption of type C gasoline reduced 5%.
- Vehicle licensing: In 2024, 2 million new light vehicles were licensed, an increase of 9%. The number of electrified vehicles (hybrid and electric) increased by 89%, from 94,000 in 2023 to 177,300 in 2024.
- Vehicle Imports: The rate for importing combustion cars is 35%. Electric and hybrid vehicles will also be taxed at this amount from 2026. Outside the quotas, they were taxed with intermediate tariffs, reestablished in January this year for electrified vehicles. Each modality has a different rate that evolves every semester until it reaches 35% in July 2026. 2024: electric – 10%; plug-in hybrid – 12%; hybrid – 15%.
- Biodiesel: The mandatory addition of biodiesel to diesel has been set at 14% by volume (B14) as of March 2024. Biodiesel production increased 21% to 9.1 billion liters in 2024, with soybeans as the main feedstock (74% share).
- Emissions reduction: Emissions avoided by sugarcane and corn ethanol, biodiesel, and sugarcane bioelectricity totaled 85.6 MtCO2eq in 2023.
- Biogas and Biomethane: In 2023, the installed capacity in distributed generation reached 131 MW, with a share in domestic energy supply of 460 thousand toe. There was an increase in biomethane operations and construction registrations, with production of 74.8 million m². In 2024, 81.5 million m³ were produced.
- New biofuels: HVO and sustainable aviation fuels (SAF) projects are being developed, with hydrogen seen as a promising future energy source.
- RenovaBio: Completed its fifth operational cycle, with 325 certified production units and 35.7 million retired CBIOs, reaching 92% of the goal.
- Fuel of the Future: Sanctioned on 10/08/2024. And 22% to 27%, up to 35%. B20 by 2030. 705 Mt CO2 eq by 2037 of avoided emissions. Investment of R$ 260 billion.
This Fact Sheet was prepared from a synthesis of recent literature published in high-impact open access journals and reports from nationally and internationally recognized agencies.
The work was prepared by Glaucia Mendes Souza, Full Professor at the University of São Paulo, Coordinator of the FAPESP Bioenergy Research Program BIOEN and Leader of the IEA Bioenergy Task 39 (Biofuels for Decarbonization of Transportation) and had the following panel of reviewers: Angela Oliveira da Costa, André Nassar, Arthur Cortez Pirez de Campos, Bruno Maier, Camilo Adas, Claudia Shirozaki, Danilo Perecin, Flávio Haruo Mathuiy, Luciane Chiodi, Luiz Augusto Horta Nogueira, Marjorie Guarenghi, Priscilla Cortezze, Rafael Barros Araujo, Raffaella Rossetto, Rachel Martins Henriques, Rubens Maciel Filho, Simone Pereira de Souza, Sofia Arantes.
The reviewers collaborated with the preparation of the work, based on the best of their knowledge, although no systematic review was carried out.
Contact: Glaucia Souza (glmsouza@iq.usp.br).
BIOEN, FAPESP’s Bioenergy Research Program, aims to articulate research and development (R&D) between public and private entities, using academic and industrial laboratories to advance and apply knowledge in areas related to bioenergy in Brazil. Research ranges from biomass production and processing to biofuel technologies, biorefineries, sustainability and impacts. https://bioenfapesp.org/
REFERENCES
General context of decarbonization of transportation using biofuels
1 Renewables 2018. Analysis and forecast to 2023. International Energy Agency. https://www.iea.org/reports/renewables-2018
2 IEA Net-zero Roadmap. 2023 update. https://iea.blob.core.windows.net/assets/8ad619b9-17aa-473d-8a2f-4b90846f5c19/NetZeroRoadmap_AGlobalPathwaytoKeepthe1.5CGoalinReach-2023Update.pdf
3 IEA Net-zero Roadmap. 2023 update. https://iea.blob.core.windows.net/assets/8ad619b9-17aa-473d-8a2f-4b90846f5c19/NetZeroRoadmap_AGlobalPathwaytoKeepthe1.5CGoalinReach-2023Update.pdf
4 https://www.gov.br/planalto/pt-br/media/18-11-2024-declaracao-de-lideres-g20.pdf
5 Carbon accounting for sustainable biofuels. 2024. IEA. https://www.iea.org/reports/carbon-accounting-for-sustainable-biofuels
6 Mohammadi, H. and Saddler, J. (2023). Implementation Agendas: Compare-and-Contrast Transport Biofuels Policies (2021-2023 Update). IEA Bioenergy Task 39. https://www.ieabioenergy.com/wp-content/uploads/2024/01/Implementation-Agendas-Compare-and-Contrast-Transport-Biofuels-Policies.pdf
7 Muisers, J., Jansen, A., Dijkstra, O. and Klerks, K. (2024). Improvement opportunities for policies and certification schemes promoting sustainable biofuels with low GHG emissions. Part 2: Robustness of GHG emission verification and certification of biofuels – a case study of selected supply chains and policies. IEA Bioenergy Task 39 December 2024. https://task39.ieabioenergy.com/wp-content/uploads/sites/37/2024/12/IEA-Bioenergy_T39-P3-Annex_final.pdf
8 Muisers, J., Jansen, A., Dijkstra, O. and Klerks, K. (2024). Improvement opportunities for policies and certification schemes promoting sustainable biofuels with low GHG emissions. Part 2: Robustness of GHG emission verification and certification of biofuels – a case study of selected supply chains and policies. IEA Bioenergy Task 39 December 2024. https://task39.ieabioenergy.com/wp-content/uploads/sites/37/2024/12/IEA-Bioenergy_T39-P3-Annex_final.pdf
9 https://www.iea.org/energy-system/low-emissions-fuels
11 Ahmed, S., Warne, T., Smith, E., Goemann, H., Linse, G., Greenwood, M., Kedziora, J., Sapp, M., Kraner, D., Roemer, K., Haggerty, J. H., Jarchow, M., Swanson, D., Poulter, B. and Stoy, P. C. (2021). Systematic review on effects of bioenergy from edible versus inedible feedstocks on food security. Science of Food (2021) 5:9; https://doi.org/10.1038/s41538-021-00091-6
12 Schulte, L. A., Dale, B. E., Bozzetto, S., Liebman, M., Souza, G. M., Haddad, N., … & Arbuckle, J. G. (2022). Meeting global challenges with regenerative agriculture producing food and energy. Nature Sustainability, 5(5), 384-388)
What is bioenergy
13 Souza, G. M., Victoria, R. L.; Joly, C. A.; Verdade, L. M. Bioenergy & Sustainability: Bridging the gaps. 1. ed. Paris: SCOPE, 2015. v. 72. Page 555. https://bioenfapesp.org/scopebioenergy/images/chapters/bioenergy_sustainability_scope.pdf
14 IRENA (2024). Decarbonising hard-to-abate sectors with renewables: Perspectives for the G7. April 2024. https://www.irena.org/Publications/2024/Apr/Decarbonising-hard-to-abate- sectors-with-renewables-Perspectives-for-the-G7
15 IEA Net-zero Roadmap. 2023 update. https://iea.blob.core.windows.net/assets/8ad619b9-17aa-473d-8a2f-4b90846f5c19/NetZeroRoadmap_AGlobalPathwaytoKeepthe1.5CGoalinReach-2023Update.pdf
What is bioenergy expected growth?
16 IEA Net-zero Roadmap. 2023 update. https://iea.blob.core.windows.net/assets/8ad619b9-17aa-473d-8a2f-4b90846f5c19/NetZeroRoadmap_AGlobalPathwaytoKeepthe1.5CGoalinReach-2023Update.pdf
17 IEA Net-zero Roadmap. 2023 update. https://iea.blob.core.windows.net/assets/8ad619b9-17aa-473d-8a2f-4b90846f5c19/NetZeroRoadmap_AGlobalPathwaytoKeepthe1.5CGoalinReach-2023Update.pdf
18 IEA (2024), Renewables 2024, IEA, Paris. https://www.iea.org/reports/renewables-2024
Main biofuels in use in the world: biodiesel, ethanol and HVO
19 Cantarella, H. ; Leal-Silva, J. F.; Nogueira, L. A.; Maciel Filho, R.; Rossetto, R.; Ekbom, T.; Souza, G. M.; Mueller-Langer, F. (2023). Biofuel technologies: Lessons learned and pathways to decarbonization. Global Change Biology Bioenergy. 1-14. https://onlinelibrary.wiley.com/doi/full/10.1111/gcbb.13091
20 van Dyk, S.. Su, J., Saddler, J. (2024). Update on drop-in biofuel and co-processing commercialization
IEA Bioenergy: Task 39. ISBN# 979-12-80907-40-0. https://task39.ieabioenergy.com/wp-content/uploads/sites/37/2024/07/IEA-Bioenergy-Task-39-drop-in-biofuels-and-co-processing-report-June-2024.pdf
21 Canabarro, N.I.; Silva-Ortiz, P.; Nogueira, L.A.H.; Cantarella, H.; Maciel Filho, R.; Souza, G.M. (2023). Sustainability assessment of ethanol and biodiesel production in Argentina, Brazil, Colombia, and Guatemala. Renewable & Sustainable Energy Reviews. 171: 113019. https://www.sciencedirect.com/science/article/pii/S1364032122009005
23 https://www.cnnbrasil.com.br/economia/macroeconomia/empresas-fecham-acordo-para-testar-etanol-como-combustivel-para-transporte-maritimo/?utm_source=chatgpt.com & https://eixos.com.br/empresas/cmm-e-wartsila-vao-desenvolver-embarcacoes-de-apoio-movidas-a-etanol/?utm_source=chatgpt.com
Main raw materials for biofuels in Brazil: sugarcane, corn, soybean, animal fat, and wheat
Biofuels production capacity
27 ANP (2025).Painel Dinâmico de Produtores de Etanol. https://www.gov.br/anp/pt-br/centrais-de-conteudo/paineis-dinamicos-da-anp/paineis-e-mapa-dinamicos-de-produtores-de-combustiveis-e-derivados/painel-dinamico-de-produtores-de-etanol
28 https://etanoldemilho.com.br/dados-setoriais/
29 https://etanoldemilho.com.br/dados-setoriais/
32 Canabarro, N.I.; Silva-Ortiz, P.; Nogueira, L.A.H.; Cantarella, H.; Maciel Filho, R.; Souza, G.M. (2023). Sustainability assessment of ethanol and biodiesel production in Argentina, Brazil, Colombia, and Guatemala. Renewable & Sustainable Energy Reviews. 171: 113019. https://www.sciencedirect.com/science/article/pii/S1364032122009005
33 Silva, J. F. L.; Cantarella, H.; Nogueira, L. A. H.; Rossetto, R.; Maciel-Filho, R.; Souza, G. M. (2024). Biofuels in Emerging Markets of Africa and Asia. IEA Bioenergy, 2024. https://task39.ieabioenergy.com/wp-content/uploads/sites/37/2024/10/Emerging-Markets-Policy-Brief-pb2_v06.pdf & https://task39.ieabioenergy.com/wp-content/uploads/sites/37/2024/10/Biofuels-in-Emerging-Markets-Factsheet-G20.pdf
34 Cherubin, M. R.; Carvalho, J. L. N.; Cerri, C. E. P.; Nogueira, L. A. H.; Souza, G. M.; Cantarella, H. (2021). Land Use and Management Effects on Sustainable Sugarcane-Derived Bioenergy. Land, 10,72. https://www.ieabioenergy.com/wp-content/uploads/2023/04/Release-English-Land-Use-in-Brazil-for-Task-45.pdf & https://www.mdpi.com/2073-445X/10/1/72
35 Osseweijer, P., Watson, H. K., Johnson, F. X., Batistella, M., Cortez, L. A. B., Lynd, L. R., Kaffka, S. R., Long, S. P., van Meijl, H., Nassar, A. M. and Woods, J. (2015). Bioenergy and Food Security in Souza, G. M.; Victoria, R. L.; Joly, C. A.; Verdade, L. M. Bioenergy & Sustainability: Bridging the gaps. 1. ed. Paris: SCOPE, 2015. v. 72. Page 95. https://bioenfapesp.org/scopebioenergy/images/chapters/bioenergy_sustainability_scope.pdf
36 https://etanoldemilho.com.br/dados-setoriais/
38 Waclawovsky, A. J., Sato, P. M., Lembke, C. G., Moore, P. H., Souza, G. M. (2010). Sugarcane for bioenergy production: an assessment of yield and regulation of sucrose content. Plant Biotechnology Journal 8 (3), 263-276.
39 Muisers, J., Jansen, A., Dijkstra, O. and Klerks, K. (2024). Improvement opportunities for policies and certification schemes promoting sustainable biofuels with low GHG emissions. Part 2: Robustness of GHG emission verification and certification of biofuels – a case study of selected supply chains and policies. IEA Bioenergy Task 39 December 2024. https://task39.ieabioenergy.com/wp-content/uploads/sites/37/2024/12/IEA-Bioenergy_T39-P3-Annex_final.pdf
40 Enciso, S. R. A., Fellmann, T., Dominguez, I. P., Santini, F. (2016). Abolishing biofuel policies: Possible impacts on agricultural price levels, price variability and global food security. Food Policy 61, 9-26. https://www.sciencedirect.com/science/article/pii/S0306919216000166
41 Justus, M., Bachion, L. C., Arantes, S. M., Ramalho Moreira, M. M., & Rodrigues, L. (2024). Did the entry of the corn ethanol industry in Brazil affect the relationship between domestic and international corn prices? GCB Bioenergy, 16(9), e13181. https://doi.org/10.1111/gcbb.13181
42 Gurgel, A. C., Seabra, J. E., Arantes, S. M., Moreira, M. M., Lynd, L. R., & Galindo, R. (2024). Contribution of double-cropped maize ethanol in Brazil to sustainable development. Nature Sustainability, 1-12.
Productive model of Brazilian tropical agriculture and its environmental and social benefits
43 Boletim Agro Sustentável. Edição 9 – Jun 2024. Embaixada do Brasil, Lisboa. https://ugc.production.linktr.ee/ed37ef0a-853a-4eee-8887-f3ebb175382f_AF-Boletim-Agro-Sustent-vel-edicao-9-JUN-2024.pdf
44 Embrapa. https://www.embrapa.br/car-2021/resultados
45 Gurgel, A. C., Seabra, J. E. A., Arantes, S. M., Moreira, M. M. R., Lynd, L. R. and Galindo, R. (2024). Contribution of double-cropped maize ethanol in Brazil to sustainable development. Nature Sustainability volume 7, 1429–1440. https://www.nature.com/articles/s41893-024-01424-5
46 Berndes, G., Youngs, H., Ballester, M. V. R., Cantarella, H., Cowie, A. L., Jewitt, G., Martinelli, L. A. and Neary, D. (2015). Soils and Water in Bioenergy & Sustainability: Bridging the gaps. 1. ed. Paris: SCOPE, 2015. v. 72. Pages 619-659. https://bioenfapesp.org/scopebioenergy/images/chapters/bioenergy_sustainability_scope.pdf
47 Cherubin, M. R.; Carvalho, J. L. N.; Cerri, C. E. P.; Nogueira, L. A. H.; Souza, G. M.; Cantarella, H. (2021). Land Use and Management Effects on Sustainable Sugarcane-Derived Bioenergy. Land, 10,72. https://www.ieabioenergy.com/wp-content/uploads/2023/04/Release-English-Land-Use-in-Brazil-for-Task-45.pdf & https://www.mdpi.com/2073-445X/10/1/72
48 Joly, C. A., Verdade, L. M., Huntley, B. J., Dale, V. H., Mace, G., Muok, B. and Ravindranath, N. H. (2015). Biofuel Impacts on Biodiversity and Ecosystem Services in Souza, G. M.; Victoria, R. L.; Joly, C. A.; Verdade, L. M. Bioenergy & Sustainability: Bridging the gaps. 1. ed. Paris: SCOPE, 2015. v. 72. Page 555. https://bioenfapesp.org/scopebioenergy/images/chapters/bioenergy_sustainability_scope.pdf
132 Potential of “land-saving” techniques in biofuel production in Brazil. https://www.epe.gov.br/sites-en/publicacoes-dados-abertos/publicacoes/PublicacoesArquivos/publicacao-265/FS-EPE-DPG-SDB-2024-03-Land-Saving_ENG.pdf
49 Guarenghi, M. M., Garofalo, D. F., Seabra, J. E., Moreira, M. M., Novaes, R. M., Ramos, N. P., … & de Andrade, C. A. (2023). Land use change net removals associated with sugarcane in Brazil. Land, 12(3), 584.
50 Guarenghi, M. M., Garofalo, D. F., Seabra, J. E., Moreira, M. M., Novaes, R. M., Ramos, N. P., … & de Andrade, C. A. (2023). Land use change net removals associated with sugarcane in Brazil. Land, 12(3), 584.
51 Hernandes T. A. D; et al., (2022). Implications of regional agricultural land use dynamics and deforestation associated with sugarcane expansion for soil carbono stocks in Brazil. Reg. Environ. Chang., 22, 49.
52 Moraes, M. A. F. D., Oliveira, F. C. R. and Diaz-Chavez, R. A. (2015). Socio-economic impacts of Brazilian sugarcane industry. Environ. Dev. 16,31-43. https://doi.org/10.1016/J.ENVDEV.2015.06.010
53 Moraes, M. A. F. D., Bacchi, M. R. P. and Caldarelli, C. E. (2016). Accelerated growth of the sugarcane, sugar, and ethanol sectors in Brazil (2000–2008): Effects on municipal gross domestic product per capita in the south-central region. Biomass Bioenergy 91,116–25. https://doi.org/10.1016/J.BIOMBIOE.2016.05.004
54 https://unicadata.com.br/listagem.php?idMn=158
55 BANCO NACIONAL DE DESENVOLVIMENTO ECONÔMICO E SOCIAL; CENTRO DE GESTÃO E ESTUDOS ESTRATÉGICOS (coord.). Bioethanol: fast track to mobility decarbonization: summary for policy makers. Rio de Janeiro: Banco Nacional de Desenvolvimento Econômico e Social, 2024. 40 p. http://web.bndes.gov.br/bib/jspui/handle/1408/25507
56 Moraes, M. A. F. D., Oliveira, F. C. R. and Diaz-Chavez, R. A. (2015). Socio-economic impacts of Brazilian sugarcane industry. Environ. Dev. 16,31-43. https://doi.org/10.1016/J.ENVDEV.2015.06.010
57 Moraes, M. A. F. D., Bacchi, M. R. P. and Caldarelli, C. E. (2016). Accelerated growth of the sugarcane, sugar, and ethanol sectors in Brazil (2000–2008): Effects on municipal gross domestic product per capita in the south-central region. Biomass Bioenergy 91,116–25. https://doi.org/10.1016/J.BIOMBIOE.2016.05.004
58 https://unicadata.com.br/listagem.php?idMn=146
59 Martinez, D. M. and Ebenhack, B. W. (2008). Understanding the role of energy consumption in human development through the use of saturation phenomena. Energy Policy 36, 1430-1435
Production potential for reuse of degraded land and expansion of bioenergy into pastureland
60 FAO. 2024. Land statistics 2001–2022 – Global, regional and country trends. FAOSTAT Analytical Briefs, No. 88. Rome.
https://doi.org/10.4060/cd1484en & https://openknowledge.fao.org/handle/20.500.14283/cd1484en
61 Woods, J., Lynd, L., Laser, M., Batistella, M., Victoria, D., Kline K. L. (2015) Land and Bioenergy in Souza, G. M.; Victoria, R. L.; Joly, C. A.; Verdade, L. M. Bioenergy & Sustainability: Bridging the gaps. 1. ed. Paris: SCOPE, 2015. v. 72. 259-300.
62 Youngs, H., Nogueira, L. A. H., Somerville, C. R., Goldemberg, J. (2015). Perspectives on Bioenergy in Bioenergy & Sustainability: Bridging the gaps. 1. ed. Paris: SCOPE, 2015. v. 72, 231-256.
63 Richard, T. and El-Lakany, H. (2015). Agriculture and Forestry Integration in Souza, G. M.; Victoria, R. L.; Joly, C. A.; Verdade, L. M. Bioenergy & Sustainability: Bridging the gaps. 1. ed. Paris: SCOPE, 2015. v. 72, 469-489.
64 Canabarro, N.I.; Silva-Ortiz, P.; Nogueira, L.A.H.; Cantarella, H.; Maciel Filho, R.; Souza, G.M. (2023). Sustainability assessment of ethanol and biodiesel production in Argentina, Brazil, Colombia, and Guatemala. Renewable & Sustainable Energy Reviews. 171: 113019. https://www.sciencedirect.com/science/article/pii/S1364032122009005
65 Silva, J. F. L.; Cantarella, H.; Nogueira, L. A. H.; Rossetto, R.; Maciel-Filho, R.; Souza, G. M. (2024). Biofuels in Emerging Markets of Africa and Asia. IEA Bioenergy, 2024. https://task39.ieabioenergy.com/wp-content/uploads/sites/37/2024/10/Emerging-Markets-Policy-Brief-pb2_v06.pdf & https://task39.ieabioenergy.com/wp-content/uploads/sites/37/2024/10/Biofuels-in-Emerging-Markets-Factsheet-G20.pdf
66 ELOBEID, A., MOREIRA, M. M. R., ZANETTI DE LIMA, CARRIQUIRY, C. M., and HARFUCH, L. Implications of biofuel production on direct and indirect land use change: Evidence from Brazil, in Biofuels, Bioenergy and Food Security, Elsevier, 2019, pp. 125–143.
67 BOLFE et al. (2024) Bolfe, É.L.; Victoria, D.d.C.; Sano, E.E.; Bayma, G.; Massruhá, S.M.F.S.; de Oliveira, A.F. Potential for Agricultural Expansion in Degraded Pasture Lands in Brazil Based on Geospatial Databases. Land 2024, 13, 200.
68 Nogueira, G.P., Petrielli, G.P., Chagas, M.F., Henzler, D.S., Sampaio, I.L.M., Bonomi, A.M., Junqueira, T.L., Morais, E.R., & Hernandes, T. A. D. (2024). Supplying the ethanol demand for 2030 in Brazil as a land-based climate change mitigation alternative: Implications on greenhouse gases emissions. Science of The Total Environment, 951, 175782. https://doi.org/10.1016/j.scitotenv.2024.175782
70 Canabarro, N.I.; Silva-Ortiz, P.; Nogueira, L.A.H.; Cantarella, H.; Maciel Filho, R.; Souza, G.M. (2023). Sustainability assessment of ethanol and biodiesel production in Argentina, Brazil, Colombia, and Guatemala. Renewable & Sustainable Energy Reviews. 171: 113019. https://www.sciencedirect.com/science/article/pii/S1364032122009005
71 Silva, J. F. L.; Cantarella, H.; Nogueira, L. A. H.; Rossetto, R.; Maciel-Filho, R.; Souza, G. M. (2024). Biofuels in Emerging Markets of Africa and Asia. IEA Bioenergy, 2024. https://task39.ieabioenergy.com/wp-content/uploads/sites/37/2024/10/Emerging-Markets-Policy-Brief-pb2_v06.pdf & https://task39.ieabioenergy.com/wp-content/uploads/sites/37/2024/10/Biofuels-in-Emerging-Markets-Factsheet-G20.pdf
72 Silva, J. F. L.; Cantarella, H.; Nogueira, L. A. H.; Rossetto, R.; Maciel-Filho, R.; Souza, G. M. (2025).Meta-analysis of biofuels in emerging markets of Africa and Asia: green house gas savings and economic feasibility. Renewable and Sustainable Energy Reviews 213: 115465
73 Canabarro, N.I.; Silva-Ortiz, P.; Nogueira, L.A.H.; Cantarella, H.; Maciel Filho, R.; Souza, G.M. (2023). Sustainability assessment of ethanol and biodiesel production in Argentina, Brazil, Colombia, and Guatemala. Renewable & Sustainable Energy Reviews. 171: 113019. https://www.sciencedirect.com/science/article/pii/S1364032122009005
74 Silva, J. F. L.; Cantarella, H.; Nogueira, L. A. H.; Rossetto, R.; Maciel-Filho, R.; Souza, G. M. (2024). Biofuels in Emerging Markets of Africa and Asia. IEA Bioenergy, 2024. https://task39.ieabioenergy.com/wp-content/uploads/sites/37/2024/10/Emerging-Markets-Policy-Brief-pb2_v06.pdf & https://task39.ieabioenergy.com/wp-content/uploads/sites/37/2024/10/Biofuels-in-Emerging-Markets-Factsheet-G20.pdf
75 Silva, J. F. L.; Cantarella, H.; Nogueira, L. A. H.; Rossetto, R.; Maciel-Filho, R.; Souza, G. M. (2025).Meta-analysis of biofuels in emerging markets of Africa and Asia: green house gas savings and economic feasibility. Renewable and Sustainable Energy Reviews 213: 115465
76 Cherubin, M. R.; Carvalho, J. L. N.; Cerri, C. E. P.; Nogueira, L. A. H.; Souza, G. M.; Cantarella, H. (2021). Land Use and Management Effects on Sustainable Sugarcane-Derived Bioenergy. Land, 10,72. https://www.ieabioenergy.com/wp-content/uploads/2023/04/Release-English-Land-Use-in-Brazil-for-Task-45.pdf & https://www.mdpi.com/2073-445X/10/1/72
77 Cherubin, M. R.; Carvalho, J. L. N.; Cerri, C. E. P.; Nogueira, L. A. H.; Souza, G. M.; Cantarella, H. (2021). Land Use and Management Effects on Sustainable Sugarcane-Derived Bioenergy. Land, 10,72. https://www.ieabioenergy.com/wp-content/uploads/2023/04/Release-English-Land-Use-in-Brazil-for-Task-45.pdf & https://www.mdpi.com/2073-445X/10/1/72
The Food versus Fuel Non-dilemma
78 Goldemberg, J.; Souza, G. M.; Maciel -Filho, R.; Cantarella, H. (2018). Scaling up biofuels? A critical look at expectations performance and governance. Energy Policy 118, 655-657. https://www.sciencedirect.com/science/article/abs/pii/S0301421518301940?via%3Dihub
79 Osseweijer, P., Watson, H. K., Johnson, F. X., Batistella, M., Cortez, L. A. B., Lynd, L. R., Kaffka, S. R., Long, S. P., van Meijl, H., Nassar, A. M. and Woods, J. (2015). Bioenergy and Food Security in Souza, G. M.; Victoria, R. L.; Joly, C. A.; Verdade, L. M. Bioenergy & Sustainability: Bridging the gaps. 1. ed. Paris: SCOPE, 2015. v. 72. Page 95. https://bioenfapesp.org/scopebioenergy/images/chapters/bioenergy_sustainability_scope.pdf
80 Souza, G. M.; Victoria, R. L.; Verdade, L. M.; Joly, C. A.; Netto, P. E. A.; Cruz, C. H. B.; Cantarella, H.; Chum, H. L.; Cortez, L. A. B.; Diaz-Chavez, R.; Fernandes, E.; Fincher, G. B.; Foust, T.; Goldemberg, J.; Nogueira, L. A. H.; Huntley, B. J.; Johnson, F. X.; Kaffka, S.; Karp, A.; Leal, M. R. L. V. et.al. (2015). Bioenergy & Sustainability. Policy Brief. SCOPE, v. 1, p. 6. ISSN 2412-0286. https://bioenfapesp.org/scopebioenergy/images/E-VERSION-SCOPE-Final-lowres.pdf
81 FAO, GBEP, IRENA, IEA,IRENA,UNECE, et al .Joint Statement on Sustainable bioenergy for climate and development goals (2024) . Statement developed by a Cross-Initiative coordination group on bioenergy convened by the Global Bioenergy Partnership (GBEP) https://www.fao.org/climate-change/news/news-detail/sustainable-bioenergy-for-climate-and-development-goals/en
82 FAO (2012) – Energy-Smart Food at FAO: An Overview. https://www.fao.org/4/an913e/an913e00.htm
FAO, GBEP, IRENA, IEA,IRENA,UNECE, et al .Joint Statement on Sustainable bioenergy for climate and development goals (2024) . Statement developed by a Cross-Initiative coordination group on bioenergy convened by the Global Bioenergy Partnership (GBEP) https://www.fao.org/climate-change/news/news-detail/sustainable-bioenergy-for-climate-and-development-goals/en
83 FAO (2018). Sustainability of biogas and cassava-based ethanol value chains in viet nam: results and recommendations from the implementation of the Global Bioenergy Partnership indicators.
84 Schulte, L. A., Dale, B. E., Bozzetto, S., Liebman, M., Souza, G. M., Haddad, N., … & Arbuckle, J. G. (2022). Meeting global challenges with regenerative agriculture producing food and energy. Nature Sustainability, 5(5), 384-388)
85 Schulte, L. A., Dale, B. E., Bozzetto, S., Liebman, M., Souza, G. M., Haddad, N., … & Arbuckle, J. G. (2022). Meeting global challenges with regenerative agriculture producing food and energy. Nature Sustainability, 5(5), 384-388)
86 Gurgel, A. C., Seabra, J. E., Arantes, S. M., Moreira, M. M., Lynd, L. R., & Galindo, R. (2024). Contribution of double-cropped maize ethanol in Brazil to sustainable development. Nature Sustainability, 1-12.
87 Englund, O., Mola‐Yudego, B., Börjesson, P., Cederberg, C., Dimitriou, I., Scarlat, N., & Berndes, G. (2023). Large‐scale deployment of grass in crop rotations as a multifunctional climate mitigation strategy. GCB Bioenergy, 15(2), 166-184.
88 Robertson, G. P., S. K. Hamilton, K. Paustian, and P. Smith. 2022. Land-based climate solutions for the United States. Global Change Biology 28:4912-4919. https://lter.kbs.msu.edu/pub/4040
89 Osseweijer, P., Watson, H. K., Johnson, F. X., Batistella, M., Cortez, L. A. B., Lynd, L. R., Kaffka, S. R., Long, S. P., van Meijl, H., Nassar, A. M. and Woods, J. (2015). Bioenergy and Food Security in Souza, G. M.; Victoria, R. L.; Joly, C. A.; Verdade, L. M. Bioenergy & Sustainability: Bridging the gaps. 1. ed. Paris: SCOPE, 2015. v. 72. Page 95. https://bioenfapesp.org/scopebioenergy/images/chapters/bioenergy_sustainability_scope.pdf
90 FAO, GBEP, IRENA, IEA,IRENA,UNECE, et al .Joint Statement on Sustainable bioenergy for climate and development goals (2024) . Statement developed by a Cross-Initiative coordination group on bioenergy convened by the Global Bioenergy Partnership (GBEP) https://www.fao.org/climate-change/news/news-detail/sustainable-bioenergy-for-climate-and-development-goals/en
91 Gurgel, A. C., Seabra, J. E., Arantes, S. M., Moreira, M. M., Lynd, L. R., & Galindo, R. (2024). Contribution of double-cropped maize ethanol in Brazil to sustainable development. Nature Sustainability, 1-12.
92 Englund, O., Mola‐Yudego, B., Börjesson, P., Cederberg, C., Dimitriou, I., Scarlat, N., & Berndes, G. (2023). Large‐scale deployment of grass in crop rotations as a multifunctional climate mitigation strategy. GCB Bioenergy, 15(2), 166-184.
93 Robertson, G. P., S. K. Hamilton, K. Paustian, and P. Smith. 2022. Land-based climate solutions for the United States. Global Change Biology 28:4912-4919. https://lter.kbs.msu.edu/pub/4040
94 Ahmed, S., Warne, T., Smith, E., Goemann, H., Linse, G., Greenwood, M., Kedziora, J., Sapp, M., Kraner, D., Roemer, K., Haggerty, J. H., Jarchow, M., Swanson, D., Poulter, B. and Stoy, P. C. (2021). Systematic review on effects of bioenergy from edible versus inedible feedstocks on food security. Science of Food (2021) 5:9; https://doi.org/10.1038/s41538-021-00091-6
Carbon Accounting and Biofuels GHG emissions reduction potential
95 Canabarro, N.I.; Silva-Ortiz, P.; Nogueira, L.A.H.; Cantarella, H.; Maciel Filho, R.; Souza, G.M. (2023). Sustainability assessment of ethanol and biodiesel production in Argentina, Brazil, Colombia, and Guatemala. Renewable & Sustainable Energy Reviews. 171: 113019. https://www.sciencedirect.com/science/article/pii/S1364032122009005
96 Silva, J. F. L.; Cantarella, H.; Nogueira, L. A. H.; Rossetto, R.; Maciel-Filho, R.; Souza, G. M. (2024). Biofuels in Emerging Markets of Africa and Asia. IEA Bioenergy, 2024. https://task39.ieabioenergy.com/wp-content/uploads/sites/37/2024/10/Emerging-Markets-Policy-Brief-pb2_v06.pdf & https://task39.ieabioenergy.com/wp-content/uploads/sites/37/2024/10/Biofuels-in-Emerging-Markets-Factsheet-G20.pdf
97 Moreira, M. M. R., Seabra, J. E. A., Lynd, L. R., Arantes, S. M., Cunha, M. P., Guilhoto, J. J. M. (2020). Socio-environmental and land-use impacts of double-cropped maize ethanol in Brazil. NATURE SUSTAINABILITY | VOL 3 | MARCH 2020 | 209–216. https://www.nature.com/articles/s41893-019-0456-2.epdf?shared_access_token=DycLQ5Aci89fjLdVSL0IcdRgN0jAjWel9jnR3ZoTv0N8ShKvm5x7518YTSt_vDXsTIOyyNkcA5ckY37k_fcL835MNwVXg0MTvkyGCrBOnP8djhsQ3oTdABpn3XAiug3N5sSaLpwNFgT7Uno6jFFgLw%3D%3D
98 Souza, L. C. and Seabra, J. E. A. (2024). Technical-economic and environmental assessment of marine biofuels produced in Brazil. Cleaner Environmental Systems 13:100195. https://www.sciencedirect.com/science/article/pii/S2666789424000333
99 Carvalho, F., Müller-Casseres, E., Poggo, M., Nogueira, T., Fonte, C., Wei, H. K., Portugal-Pereira, J., Rochedo, P. R. R., Szklo, A., Schaeffer, R. (2021). Prospects for carbon-neutral maritime fuels production in Brazil. Journal of Cleaner Production 326:129385. https://www.sciencedirect.com/science/article/abs/pii/S0959652621035691
100 Guarenghi, M. M., Garofalo, D. E. T., Seabra, J. E. A. and Moreira, M. M. R., Novaes, R. M. L., Ramos, N. P., Nogueira, S. F. and Andrade, C. A. (2023). Land Use Change Net Removals Associated with Sugarcane in Brazil. Land 12, 584; https://doi.org/10.3390/land12030584
101 Moreira, J. R.; Romeiro, V.; Fuss, S.; Florian, K.; Pacca, S. (2016). BECCS potential in Brazil: Achieving negative emissions in ethanol and electricity production based on sugar cane bagasse and other residues. Applied Energy, Amsterdam, v. 179, p. 55-63.
102 Chagas, M.; Cavalett, O.; Klein, B.; Maciel-Filho, R.; Bonomi, A.(2016). Life cycle assessment of technologies for greenhouse gas emissions reduction in sugarcane biorefineries. Chemical Engineering Transactions, v. 50, p. 421-426.
103 Carbon accounting for sustainable biofuels. 2024. IEA. https://www.iea.org/reports/carbon-accounting-for-sustainable-biofuels
104 Carbon accounting for sustainable biofuels. 2024. IEA. https://www.iea.org/reports/carbon-accounting-for-sustainable-biofuels
105 Saddler, J., McMillan, J. and Ebadian, M. (2019). Comparison of international Life Cycle Assessment (LCA) biofuels models. IEA Bioenergy Task 39. https://task39.ieabioenergy.com/wp-content/uploads/sites/37/2019/07/IEA-B-T39_Summary_LCA-Project.pdf
106 Macedo, I. C., Nassar, A. M., Cowie, A. L., Seabra, J. E. A., Marelli, L., Otto, M., Wang, M. Q., and Tyner, W. E. (2015). Greenhouse Gas Emissions from Bioenergy in Bioenergy & Sustainability: Bridging the gaps. 1. ed. Paris: SCOPE, 2015. v. 72, 583-616.
107 Macedo, I. C., Nassar, A. M., Cowie, A. L., Seabra, J. E. A., Marelli, L., Otto, M., Wang, M. Q., and Tyner, W. E. (2015). Greenhouse Gas Emissions from Bioenergy in Bioenergy & Sustainability: Bridging the gaps. 1. ed. Paris: SCOPE, 2015. v. 72, 583-616.
108 Carbon accounting for sustainable biofuels. 2024. IEA. https://www.iea.org/reports/carbon-accounting-for-sustainable-biofuels
109 Fiorini, A. C. O. et al.. Sustainable aviation fuels must control induced land use change: an integrated assessment modelling exercise for Brazil. Environmental Research Letters, Bristol, v. 18, n. 1, p. 1-11, 2023.
110 Moreira, M. M. R., Seabra, J. E. A., Lynd, L. R., Arantes, S. M., Cunha, M. P., Guilhoto, J. J. M. (2020). Socio-environmental and land-use impacts of double-cropped maize ethanol in Brazil. NATURE SUSTAINABILITY | VOL 3 | MARCH 2020 | 209–216. https://www.nature.com/articles/s41893-019-0456-2.epdf?shared_access_token=DycLQ5Aci89fjLdVSL0IcdRgN0jAjWel9jnR3ZoTv0N8ShKvm5x7518YTSt_vDXsTIOyyNkcA5ckY37k_fcL835MNwVXg0MTvkyGCrBOnP8djhsQ3oTdABpn3XAiug3N5sSaLpwNFgT7Uno6jFFgLw%3D%3D
111 Guarenghi, M. M., Garofalo, D. F., Seabra, J. E., Moreira, M. M., Novaes, R. M., Ramos, N. P., … & de Andrade, C. A. (2023). Land use change net removals associated with sugarcane in Brazil. Land, 12(3), 584.
112 Canabarro, N.I.; Silva-Ortiz, P.; Nogueira, L.A.H.; Cantarella, H.; Maciel Filho, R.; Souza, G.M. (2023). Sustainability assessment of ethanol and biodiesel production in Argentina, Brazil, Colombia, and Guatemala. Renewable & Sustainable Energy Reviews. 171: 113019. https://www.sciencedirect.com/science/article/pii/S1364032122009005
113 Moreira, M. M. R., Seabra, J. E. A., Lynd, L. R., Arantes, S. M., Cunha, M. P., Guilhoto, J. J. M. (2020). Socio-environmental and land-use impacts of double-cropped maize ethanol in Brazil. NATURE SUSTAINABILITY | VOL 3 | MARCH 2020 | 209–216. https://www.nature.com/articles/s41893-019-0456-2.epdf?shared_access_token=DycLQ5Aci89fjLdVSL0IcdRgN0jAjWel9jnR3ZoTv0N8ShKvm5x7518YTSt_vDXsTIOyyNkcA5ckY37k_fcL835MNwVXg0MTvkyGCrBOnP8djhsQ3oTdABpn3XAiug3N5sSaLpwNFgT7Uno6jFFgLw%3D%3D
114 Fiorini, A. C. O. et al.. Sustainable aviation fuels must control induced land use change: an integrated assessment modelling exercise for Brazil. Environmental Research Letters, Bristol, v. 18, n. 1, p. 1-11, 2023.
115 Carbon Accounting of Biofuels – Workshop Synthesis Report. (2024). https://biofutureplatform.org/news/carbon-accounting-of-biofuels/
Biofuels certification
117 Mohammadi, H. and Saddler, J. (2023). Implementation Agendas: Compare-and-Contrast Transport Biofuels Policies (2021-2023 Update). IEA Bioenergy Task 39. https://www.ieabioenergy.com/wp-content/uploads/2024/01/Implementation-Agendas-Compare-and-Contrast-Transport-Biofuels-Policies.pdf
118 Muisers, J., Jansen, A., Dijkstra, O. and Klerks, K. (2024). Improvement opportunities for policies and certification schemes promoting sustainable biofuels with low GHG emissions. Part 2: Robustness of GHG emission verification and certification of biofuels – a case study of selected supply chains and policies. IEA Bioenergy Task 39 December 2024. https://task39.ieabioenergy.com/wp-content/uploads/sites/37/2024/12/IEA-Bioenergy_T39-P3-Annex_final.pdf
119 Redmond, A., Unnasch, S., Healy, B.D., & Camacho, F. (2024). Biomass – _Accounting Principles, Alternative Fates, and Verification. Life Cycle Associates Report LCA.8192.224.2023.
120 www.bonsucro.com
Carbon accounting policy frameworks
121 https://www.epe.gov.br/pt/publicacoes-dados-abertos/publicacoes/renovabio
122 Moreira, M. R., Arantes, S. M., Garofalo, D. F. T., Silva, J. F. L., Souza, G. M., Bachion, L. C., Harfuch, L., Palauro, G. R., Silveira, L., Maciel, V. G., Guarenghi, M. M., Cruz, G. M. (2024). Evaluation of the Brazilian RenovaBio conversion-free criteria on land use change emissions Brazilian Biofuel Program and the use of risk-management approach. IEA Bioenergy Task 45. https://www.ieabioenergy.com/wp-content/uploads/2024/11/Report_ILUC_RenovaBio_t45_Final-version.pdf
123 Muisers, J., Jansen, A., Dijkstra, O. and Klerks, K. (2024). Improvement opportunities for policies and certification schemes promoting sustainable biofuels with low GHG emissions. Part 2: Robustness of GHG emission verification and certification of biofuels – a case study of selected supply chains and policies. IEA Bioenergy Task 39 December 2024. https://task39.ieabioenergy.com/wp-content/uploads/sites/37/2024/12/IEA-Bioenergy_T39-P3-Annex_final.pdf
124 https://www.iea.org/energy-system/low-emissions-fuels
126 Ahmed, S., Warne, T., Smith, E., Goemann, H., Linse, G., Greenwood, M., Kedziora, J., Sapp, M., Kraner, D., Roemer, K., Haggerty, J. H., Jarchow, M., Swanson, D., Poulter, B. and Stoy, P. C. (2021). Systematic review on effects of bioenergy from edible versus inedible feedstocks on food security. Science of Food (2021) 5:9; https://doi.org/10.1038/s41538-021-00091-6
127 Muisers, J., Jansen, A., Dijkstra, O. and Klerks, K. (2024). Improvement opportunities for policies and certification schemes promoting sustainable biofuels with low GHG emissions. Part 2: Robustness of GHG emission verification and certification of biofuels – a case study of selected supply chains and policies. IEA Bioenergy Task 39 December 2024. https://task39.ieabioenergy.com/wp-content/uploads/sites/37/2024/12/IEA-Bioenergy_T39-P3-Annex_final.pdf
128 Muisers, J., Jansen, A., Dijkstra, O. and Klerks, K. (2024). Improvement opportunities for policies and certification schemes promoting sustainable biofuels with low GHG emissions. Part 2: Robustness of GHG emission verification and certification of biofuels – a case study of selected supply chains and policies. IEA Bioenergy Task 39 December 2024. https://task39.ieabioenergy.com/wp-content/uploads/sites/37/2024/12/IEA-Bioenergy_T39-P3-Annex_final.pdf
129 Muisers, J., Jansen, A., Dijkstra, O. and Klerks, K. (2024). Improvement opportunities for policies and certification schemes promoting sustainable biofuels with low GHG emissions. Part 2: Robustness of GHG emission verification and certification of biofuels – a case study of selected supply chains and policies. IEA Bioenergy Task 39 December 2024. https://task39.ieabioenergy.com/wp-content/uploads/sites/37/2024/12/IEA-Bioenergy_T39-P3-Annex_final.pdf
130 Muisers, J., Jansen, A., Dijkstra, O. and Klerks, K. (2024). Improvement opportunities for policies and certification schemes promoting sustainable biofuels with low GHG emissions. Part 2: Robustness of GHG emission verification and certification of biofuels – a case study of selected supply chains and policies. IEA Bioenergy Task 39 December 2024. https://task39.ieabioenergy.com/wp-content/uploads/sites/37/2024/12/IEA-Bioenergy_T39-P3-Annex_final.pdf
Key developments in 2024 in Brazil
131 Analysis of Current Biofuels Outlook –Year 2023. TECHNICAL NOTE EPE/DPG/SDB/2024/03EPE. https://www.epe.gov.br/sites-pt/publicacoes-dados-abertos/publicacoes/PublicacoesArquivos/publicacao-834/NT-EPE-DPG-SDB-2024-03_Biofuels%20Current%20Outlook_Year2023.pdf